Translate this page into:
Role of Platelet Function Test in Predicting Postoperative Bleeding Risk after Coronary Artery Bypass Grafting: A Prospective Observational Study
Poonam Malhotra Kapoor, MD, DNB, MNAMS, FIACTA, FTEE, FISCU Department of Cardiac Anaesthesia, CTC, AIIMS New Delhi India drpoonamaiims@gmail.com
This article was originally published by Thieme Medical and Scientific Publishers Pvt. Ltd. and was migrated to Scientific Scholar after the change of Publisher.
Abstract
Patients undergoing cardiac surgery are at risk of excessive bleeding and its associated complications. Excessive bleeding during and after cardiac surgery has an incidence of ~20%. Massive bleeding and subsequent requirement for blood product administration and mediastinal reexploration are associated with significant morbidity and mortality. Postoperative, nonsurgical bleeding in cardiac surgical patients is often multifactorial. Platelet dysfunction, excessive fibrinolysis, hypothermia, preoperative anemia, and deficiency of coagulation factors or their dilution are all suggested etiologies of postoperative bleeding. In the Arachidonic Acid Thromboelastometry (ARATEM) test, platelets are activated with arachidonic acid; in Adenosine diphosphate Thromboelastometry (ADPTEM) test, platelets are activated with adenosine diphosphate; and in TRAPTEM test, platelets are activated with thrombin receptor-activating peptide 6. Measurement time is 6 minutes, and results are expressed in three different parameters: A6 (amplitude at 6 minutes, in Ohm); MS (maximum slope of the aggregation curve in Ohm/min), and AUC (area under the curve in Ohm.min). Algorithm-based point-of-care platelet function testing helped us to preemptively give the right blood component therapy, avoiding fibrinolytic bleeding in the postoperative period.
Keywords
CABG
platelet function testing
predicting postoperative bleeding risk

Introduction
Patients undergoing cardiac surgery are at risk of excessive bleeding and its associated complications.1 Excessive bleeding during and after cardiac surgery has an incidence of ~20%.2 Massive bleeding and subsequent requirement for blood product administration and mediastinal reexploration are associated with significant morbidity and mortality.3 Postoperative, nonsurgical bleeding in cardiac surgical patients is often multifactorial. Platelet dysfunction, excessive fibrinolysis, hypothermia, preoperative anemia, and deficiency of coagulation factors or their dilution are all suggested etiologies of postoperative bleeding.2 Among these, the most important is thought to be platelet dysfunction, which occurs as a result of the interplay of acquired and pharmacologically induced factors.4, 5 Patients suffering from coronary artery disease are usually advised to stop antiplatelet medications a few days prior to coronary artery bypass grafting (CABG) to reduce the incidence of postoperative bleeding.6 However, patients who are still on antiplatelet drugs are at an increased risk of postoperative bleeding.7, 8 Predicting postoperative bleeding risk in these patients is difficult. Transfusions of blood and blood products have got deleterious effects, and hence efforts should be made to minimize transfusion.9 Currently, the transfusion of blood and blood components to manage postoperative bleeding after CABG remains largely empirical, with considerable variation among institutions.10 Platelet function analysis tests available today in 2021 are not just for diagnosis and management of patients with hemostatic disorder, but with the advent of point-of-care (POC) testing, sample processing is done away with. What is available in 2021, today, for thrombosis and bleeding is adequate POC testing for the etiology of bleeding but there is still lack of awareness of its use and interpretation. Identifying potential causes of abnormal bleeding, monitoring prohemostatic therapy, preoperatively and postoperatively,11, 12, 13 predicting surgical bleeding, monitoring desmopressin therapy and other antiplatelet drug therapies, and doing quality control of platelet concentrates in the patient are an urgent need today. A large number of published guidelines exist, which may be used to minimize platelet activation and aggregation,14 one of which is minimizing delays in time form sampling to analysis as ensuring sample quality is essential. Algorithm-based hemostatic therapy has been shown to be superior to empiric hemostatic therapy that is based on clinical judgment.15 Hence, there is a need to have objective tests to demonstrate platelet dysfunction before platelet transfusion.10 Several devices platelet function tests have been reported in clinical studies to evaluate platelet dysfunction and quantify the need for antiplatelet therapy.7, 10 Those devices range from highly sophisticated ones, such as light transmittance aggregometers and whole blood flow cytometers, to simple POC technologies. The problem is that no consensus exists concerning several issues: which device is optimal, what cutoff values to apply for discrimination of bleeding risk, and how to proceed with antiplatelet strategies once the results of platelet testing are determined?16
We hypothesized that objective measurement of platelet function can be useful in prediction of postoperative blood loss and in guiding postoperative transfusion requirements (blood and platelets) and the need for surgical reexploration. Hence, we designed a prospective observational study with an algorithm to investigate the association between platelet function by ROTEM Platelet aggregometry and postoperative blood loss.17
Materials and Methods
Study Design
This prospective observational study was undertaken in the Department of Cardiac Anaesthesiology, AIIMS, New Delhi after Institutional Ethics Committee approval and obtaining written informed consent from the patient or his relatives.
Methods of Collection of Data
Selection of cases: The cases were selected in a consecutive manner, between December 2020 and January 2022 after following strict inclusion and exclusion criteria.
Inclusion Criteria
Patients of either gender, belonging to American Society of Anaesthesiologists grade I to III undergoing isolated CABG using cardiopulmonary bypass (CPB), were enrolled in the study.
Exclusion Criteria
-
Patients on preoperative single antiplatelet therapy with Aspirin.
-
Patients undergoing off-pump CABG.
-
Patients with known coagulopathy.
-
Patients undergoing emergency surgery.
-
Patients with preoperative renal or hepatic impairment.
-
Platelet count < 100 × 109 /L
Methodology
Preanesthetic examination was performed 1 day prior to surgery. The procedure was explained to the patient and written informed consent was obtained. Anesthesia was induced with etomidate (0.2–0.3 mg/kg) or thiopentone (3–5mg/kg), fentanyl (2–3 µg/kg), and rocuronium bromide (0.8–1 mg/kg). Patient was intubated with Portex endotracheal tube of appropriate size. Anesthesia was maintained using sevoflurane (0.5–1%) in oxygen air mixture with intermittent doses of fentanyl, midazolam, and cisatracurium that is the standard practice in our institute. All patients were monitored with five lead electrocardiogram, oxygen saturation, invasive blood pressure, central venous pressure, temperature, capnography, and urine output. Patients were operated according to our standard protocol with CPB. Before cannulation, heparin (400 IU/kg) was given and supplemented as required to maintain an activated clotting time (ACT) more than 480 seconds. The standard uncoated CPB circuit was primed with 1 L lactated ringer solution, sodium bicarbonate 50 mL, 0.5 g/kg mannitol, and 10,000 IU heparin. CPB was performed with membrane oxygenator using standard nonpulsatile technique. After decannulation, heparin was neutralized with protamine sulfate (1 mg protamine per 100 IU heparin). Packed red blood cells (RBCs) were added to maintain hematocrit more than 30%. ACT and blood gas analysis was done half hourly. Pump flow was maintained between 2.2 and 3 L/m2 body surface area. Postoperative bleeding was defined as the total amount of chest tube drainage during the first 24 hours. After surgery, the decision to transfuse packed RBCs was based on clinical and hemodynamic status with the aim of maintaining the hemoglobin above 10 g/dL. Plasma was transfused for ongoing significant bleeding and increased international normalized ratio. Platelet was transfused if platelet count was < 100*106/dL and significant bleeding was observed.
Blood samples for ROTEM Platelet aggregometry were obtained at two different time points: after induction of anesthesia before heparinization (T1); and 5 to 10 minutes after protamine administration (T2) in a tube containing citrate and analyzed within 1 hour, after recalcification with 20 μL CaCl2. All measurements were performed by physicians trained to operate study device and not directly involved in the patient's care. If any of the areas under the curve (AUC) were less than the following, the normal values for the three reagents used for platelet function testing was adhered to, which are shown below
|
Test/parameter |
AUC |
A6 |
MS |
|
ADPTEM |
56–139 |
16–38 |
4–11 |
|
TRAPTEM |
61–156 |
15–36 |
5–14 |
|
ARATEM |
70–153 |
19–41 |
6–13 |
Parameters Evaluated
Demographic and perioperative data like sex, age, height, body weight, duration of CPB, postoperative chest drain output, use of blood, and blood products was observed in all patients. A baseline heart rate, blood pressure, saturation, central venous pressure, and routine hematological investigations were noted.
Patients were assigned to the “nonexcessive” and “excessive” postoperative bleeding groups, respectively, according to the postoperative chest tube drainage over 24 hours postoperatively divided by their respective bodyweight (24 hours chest tube drainage in mL/kg). If drainage over 24 hours exceeds the 75th percentile of the whole study population, patients was characterized as “excessively bleeding.”18
For each test, different parameters, after the recognition and computation by the integrated software detection: the area under the aggregation curve (AUC), the amplitude after 6 minutes (A6), and the maximum slope (MS) were noted at T1 and T2 time points. Anesthetists and surgeons (clinicians managing the patient in intensive care unit) were blinded to the results of the ROTEM Platelet aggregometry measurements. Theses parameters were correlated among themselves and with patients, EXTEM, FIBTEM, and INTEM and results were interpreted with chest drainage output after a detailed statistical analysis. These were then treated with an algorithm as devised for the study.
Statistical Analysis
Study Design
Prospective observational study, interim results.
Sample Size
Data was collected and recorded by using the Microsoft Excel Statistics Software package. In this prospective observational study, we present our interim results on 26 patients. Anticipating the risk of excessive bleeding due to platelet dysfunction in 30% patients two times more than nonexcessive bleeding group with 5% level of significance (α error) at 8% power, we need to study 103 samples to predict excessive bleeding. Continuous variables were expressed as mean ± standard deviation. Student’s “t” test was applied for comparison of means and significance was established with p-values level of 0.001 (p < 0.001). We present here our interim results on 26 subjects undergoing elective CABG, under CPB.
Results
We observed a significant reduction at T2 as compared with T1 in the CT values of EXTEM and INTEM while it was a significant increase for FIBTEM. The clot formation time values did not see any significant change at T2 as compared with T1. At the same time, the maximum clot firmness values showed significant increase in EXTEM, while decrease was seen in INTEM and FIBTEM. The A6, MS, and AUC parameters of all the three platelet indices, that is, TRAPTEM, ARATEM, and ADPTEM showed significant decrease at T2 as compared with T1 (Table 1). More importantly, from Figs. 1 - 3 we noticed a few outliers that were subsequently mapped to patients who went on to experience adverse fatal events in future. Such mappings suggested that correlations might exist between these parameters and outcome variable.
|
T1 |
T2 |
p-Value |
||
|---|---|---|---|---|
|
Mean ± SD |
Mean ± SD |
|||
|
Abbreviations: AUC, area under the curve; ICU, intensive care unit; MS, maximum slope; SD, standard deviation. Difference was significant between ADPTEM T1 and T2 and TRAPTEM T1 and T2 as well as ARATEM T1 and T2 intervals. |
||||
|
TRAPTEM |
A6 |
14.69 ± 5.13 |
10.65 ± 4.43 |
<0.001 |
|
MS |
5.08 ± 2.24 |
3.73 ± 2.09 |
0.018 |
|
|
AUC |
61.35 ± 16.55 |
48.00 ± 17.74 |
<0.001 |
|
|
ARATEM |
A6 |
11.23 ± 5.05 |
7.19 ± 2.64 |
0.001 |
|
MS |
3.50 ± 1.53 |
2.04 ± 0.96 |
<0.001 |
|
|
AUC |
55.15 ± 18.08 |
32.04 ± 12.35 |
<0.001 |
|
|
ADPTEM |
A6 |
12.96 ± 3.05 |
10.73 ± 2.57 |
0.003 |
|
MS |
5.23 ± 7.73 |
3.54 ± 1.07 |
0.143 |
|
|
AUC |
47.35 ± 7.79 |
37.04 ± 8.55 |
<0.001 |
|
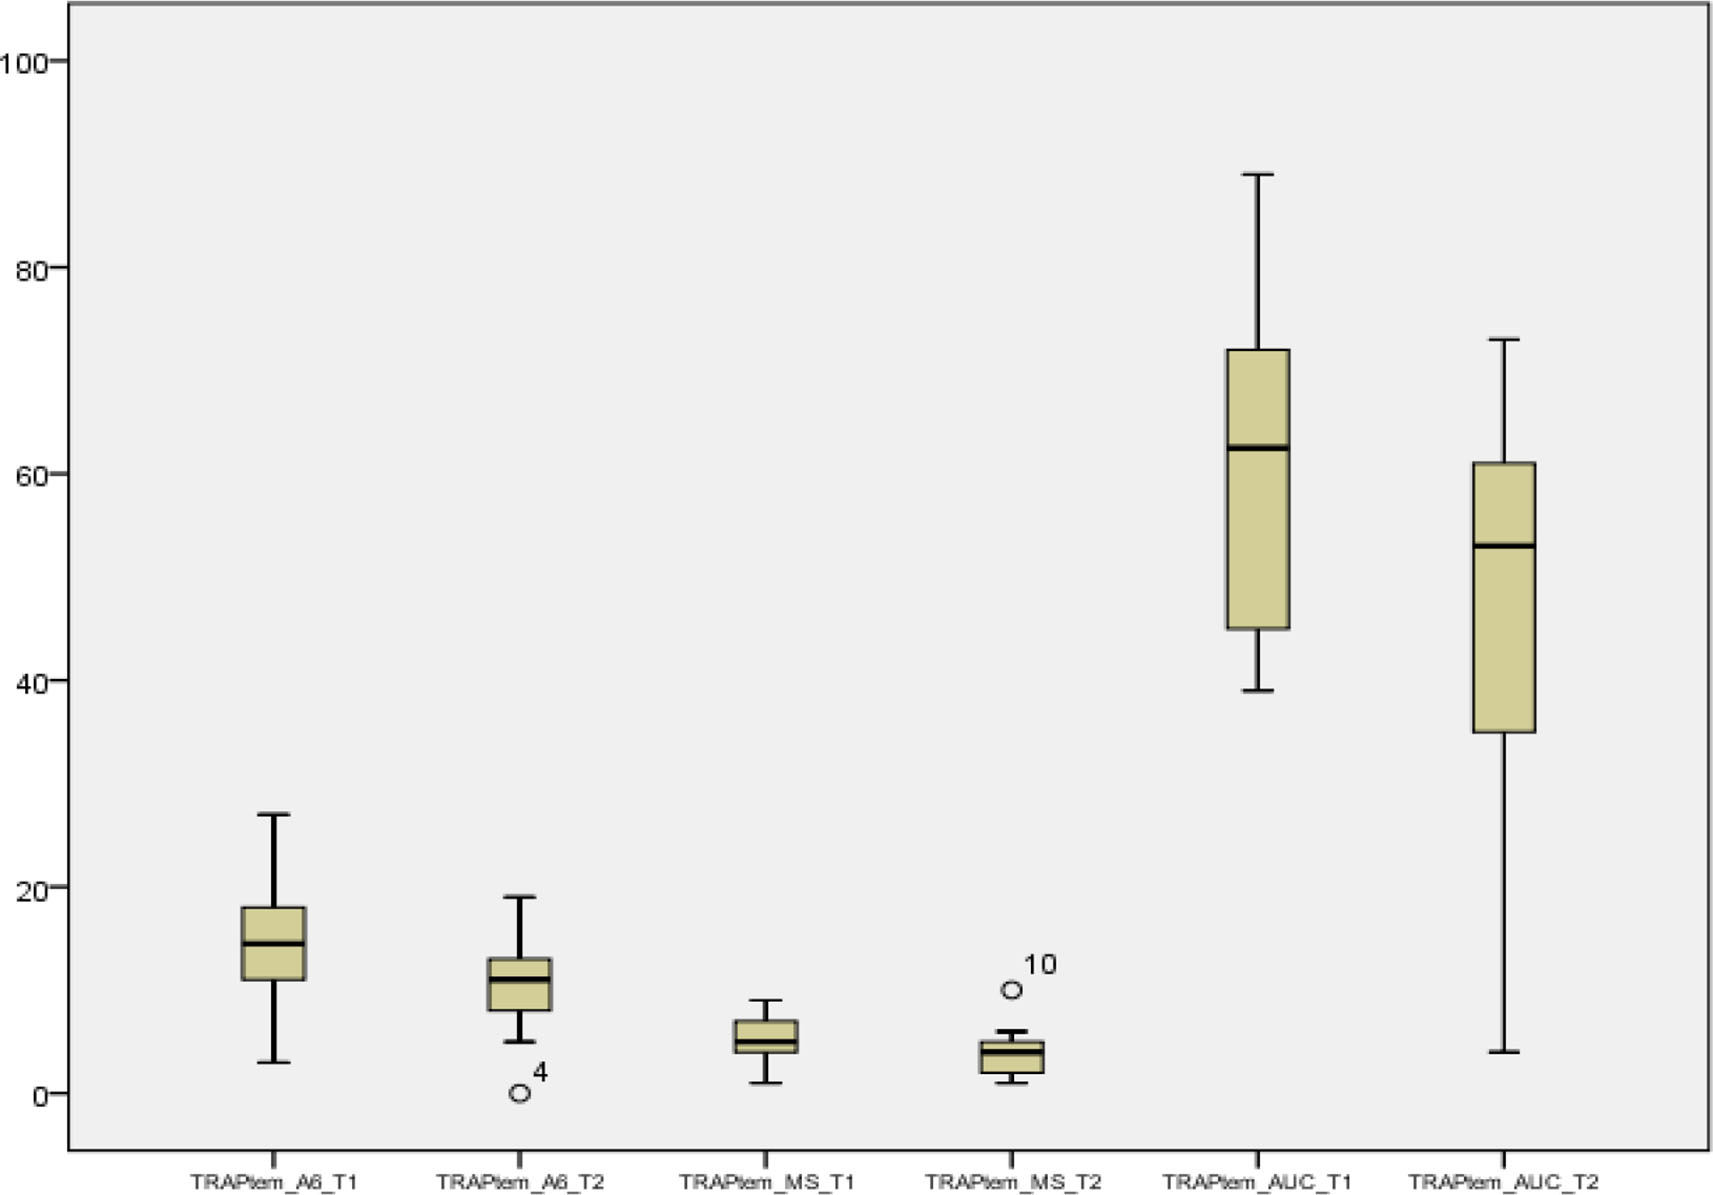
- Follow-up of TRAPTEM parameters of A6, maximum slope (MS), and area under the curve (AUC) at T1 and T2 intervals was significant to represent outliers or extreme observations beyond 3 sigma.

- Follow-up of ARATEM parameters of area under the curve (AUC) ARATEM at T1 and T2 interval is significant. MS, maximum slope.

- Follow-up of ADPTEM parameters at T1 and T2 intervals showing ADPTEM area under the curve (AUC) T1 and T2 is significant of morbidity and amount of volume loss. MS, maximum slope.
The mean blood volume loss decreased from 244.50 ± 127.19 to 140.50 ± 29.74 mL, that is, shrunk by 43.24%. As an obvious repercussion, the amount of blood transfused increased from 3.73 ± 1.43 to 5.12 ± 1.88 units. Also, the fibrinogen levels showed a significant decrease from 130.27 to 124.65 units (Table 2 and Fig. 4).
|
T1 |
T2 |
p-Value |
|||
|---|---|---|---|---|---|
|
Mean |
±SD |
Mean |
±SD |
||
|
Abbreviations: FFP, fresh frozen plasma; SD, standard deviation. |
|||||
|
Blood volume loss (Chest Tube Drainage) (ml) |
244.50 |
±127.19 |
140.50 |
±29.74 |
<0.001 |
|
Amount of blood transfused |
3.73 |
±1.43 |
5.12 |
±1.88 |
<0.001 |
|
Fibrinogen levels |
130.27 |
± 41.32 |
124.65 |
± 35.74 |
0.012 |
|
Transfusion |
1.73 |
± 0.46 |
2.0 |
± 0.42 |
<0.001 |
|
FFP |
1.60 |
± 1.18 |
3.0 |
± 0.58 |
<0.001 |
|
Cryoprecipitate |
2.13 |
± 0.46 |
2.0 |
± 1.6 |
<0.001 |
|
Percentage of aggregation |
For ADPTEM = 92.3% |
ARATEM = 88.46% |
TRAPTEM = 88.46% |
||

- Box plots depicting blood parameters Receiver operating characteristic (ROC) curve of platelet indices with respect to adverse fatal outcome. AUC, area under the curve.
From Table 3, we observed that there is no significant correlation between blood volume loss and A6, MS parameters of platelet indices. However, AUC showed a significant negative correlation suggesting that increase in AUC leads to decrease in blood loss (Fig. 5). Hence, increased AUC is an indicator of better outcomes. Similar results were observed in correlation of these parameters with amount of blood transfused (Table 4 and Fig. 6).
|
Blood loss at T1 versus |
T1 |
T2 |
|||
|---|---|---|---|---|---|
|
r |
p-Value |
r |
p-Value |
||
|
Abbreviations: AUC, area under the curve; MS, maximum slope. |
|||||
|
TRAPTEM |
A6 |
–0.083 |
0.686 |
–0.023 |
0.909 |
|
MS |
0.014 |
0.946 |
0.117 |
0.570 |
|
|
AUC |
–0.695 |
<0.001 |
–0.249 |
0.220 |
|
|
ARATEM |
A6 |
–0.253 |
0.212 |
0.084 |
0.684 |
|
MS |
–0.159 |
0.437 |
–0.021 |
0.918 |
|
|
AUC |
–0.604 |
0.001 |
–0.270 |
0.182 |
|
|
ADPTEM |
A6 |
0.487 |
0.012 |
–0.239 |
0.240 |
|
MS |
–0.075 |
0.717 |
–0.281 |
0.165 |
|
|
AUC |
–0.678 |
<0.001 |
–0.224 |
0.272 |
|
|
Amount of blood transfused at T1 versus T2 |
T1 |
T2 |
|||
|---|---|---|---|---|---|
|
r |
p-Value |
r |
p-Value |
||
|
Abbreviations: AUC, area under the curve; MS, maximum slope. |
|||||
|
TRAPTEM |
A6 |
–0.154 |
0.454 |
–0.072 |
0.726 |
|
MS |
0.069 |
0.737 |
–0.092 |
0.654 |
|
|
AUC |
–0.675 |
<0.001 |
–0.350 |
0.080 |
|
|
ARATEM |
A6 |
–0.130 |
0.528 |
0.004 |
0.986 |
|
MS |
–0.174 |
0.396 |
–0.109 |
0.596 |
|
|
AUC |
–0.481 |
0.013 |
–0.219 |
0.282 |
|
|
ADPTEM |
A6 |
0.245 |
0.228 |
–0.369 |
0.064 |
|
MS |
–0.237 |
0.244 |
–0.321 |
0.110 |
|
|
AUC |
–0.454 |
0.020 |
–0.343 |
0.087 |
|

- Scatter plots of correlation between blood loss and platelet indices showing that PI parameters decrease in area under the curve (AUC) as blood volume loss increases.

- Algorithm used at AIIMS for studying platelet functions in coronary artery bypass grafting patients. AUC, area under the curve; MS, maximum slope.
The AUC component of all the three platelet indices was correlated with adverse fetal outcome. Area under receiver operating characteristic curve for TRAPTEM is 91.6%, ARATEM is 93.2%, and ADPATEM is 93.6% (p-values = 0.001). The threshold value for TRAPTEM AUC to identify adverse fatal outcome is 53 that yields a sensitivity of 100%, specificity of 84.21%, positive predictive value (PPV) of 70%, negative predictive value (NPV) of 100%, and accuracy of 88.46%. Also, threshold value for ARATEM AUC to identify adverse fatal outcome is 49.5 that yields a sensitivity of 100%, specificity of 84.21%, PPV of 70%, NPV of 100%, and accuracy of 88.46%. Further, threshold value for ADPTEM AUC to identify adverse fatal outcome is 43 that yields a sensitivity of 85.71%, specificity of 94.74%, PPV of 85.71%, NPV of 94.74%, and accuracy of 92.31%.
Discussion
Predicting postoperative bleeding risk in these patients is easy if we use a preoperative point of care like ROTEM. The ROTEMPlatelet (TEM International GmbH, Munich, Germany) is a new module that can be added to the ROTEM. It measures platelet aggregation using impedance aggregometry. During measurement, platelets are activated with different agonists. In the ARATEM test, platelets are activated with arachidonic acid; in ADPTEM test, platelets are activated with adenosine diphosphate (ADP), and in TRAPTEM test, platelets are activated with thrombin receptor-activating peptide 6. Measurement time is 6 minutes, and results are expressed in three different parameters: A6 (amplitude at 6 minutes, in Ohm), MS (maximum slope of the aggregation curve in Ohm/min), and AUC (area under the curve in Ohm.min). A6 describes how well platelets aggregate after selective activation. MS is a measure of the rate of aggregation and describes how quickly platelets aggregate after selective activation. The AUC represents the area under the aggregation curve, from the start of the measurement until 6 minutes of run time. AUC reflects the overall platelet aggregation.19, 20
Recent studies have investigated the capability of different types of POC platelet function tests to predict the risk of postoperative bleeding; a nonstandardized approach in study design and reporting results, coupled with lack of consensus in definition of observed outcomes and various devices used, makes it difficult to pool the evidence on the exact role of POC platelet function testing in routine hemostatic management. We will assess platelet function with three activators at two different time points: before surgery and after heparin reversal with protamine and evaluate whether perioperative platelet function, as assessed by impedance aggregometry at two different time points, may reflect bleeding measured as the volume of postoperative chest tube drainage.
Platelet dysfunction may contribute to hemostatic alterations in cardiac surgery and can be influenced by preoperative antiplatelet therapy, comorbidities, or the effects of CPB itself.18 Therefore, perioperative platelet function analysis might have value in prediction of excessive bleeding and transfusion requirements and guiding hemostatic interventions.
Fattorutto et al studied if the platelet function analyzer (PFA-100) could predict blood loss after CPB. PFA-100 device failed to predict postoperative bleeding in CABG patients.21 Berger et al prospectively studied 50 patients of patients undergoing isolated CABG to determine the relationships among several assays (VerifyNow, TEG, AggreGuideTM, Platelet works, vasodilator-stimulated phosphoprotein phosphorylation, and light transmission aggregometry) purported to assess platelet function and perioperative bleeding outcomes. There was very poor correlation among the methods of assessing platelet function that were studied, and between these methods and perioperative bleeding.22 Whether any of these assays should be used to guide decision making in individual patients is unclear. Treatment with P2Y12 receptor antagonists increases the risk of perioperative bleeding, but there is individual variation in the antiplatelet effect and time to offset of this effect. Malm et al investigated whether preoperative platelet function analyzed using multiplate whole blood aggregometry predicts the risk of bleeding complications in ticagrelor-treated cardiac surgery patients. They concluded that preoperative ADP-induced platelet aggregability predicts the risk for severe bleeding complications in ticagrelor-treated cardiac surgery patients.23 Della Corte et al studied the possible value of routine aggregometry testing for bleeding prediction following on pump CABG in patients who received preoperative antiplatelet therapy. Aggregometry was analyzed by multiplate analyzer immediately before surgery. They concluded that aggregometry testing can help in predicting postoperative bleeding in patients undergoing CABG.24 For adverse fatal outcomes, the distribution of ADP inhibition was at a cutoff value of 43 to 92.3% for ARATEM at a cutoff value of 49.5 to 88.46% and for TRAPTEM at 53 again 88.46%. Timing of elective cardiac surgery is a major concern in patients with coronary artery disease, who are receiving dual antiplatelet drugs like aspirin, clopidogrel, and ticagrelor. This study has demonstrated that patients who undergo CABG may have increased blood volume loss through chest drains (Table 5) and giving the right component therapy helps decrease the postoperative bleeding. Järemo et al also commented on the importance of performing platelet function tests preoperatively in patients undergoing cardiothoracic surgery to reduce postoperative blood loss and right therapy given as a platelet concentrate to cryoprecipitate to have good patient outcomes.25
|
Outcome → |
Adverse fatal |
Normal |
p-Value |
Accuracy |
|||||
|---|---|---|---|---|---|---|---|---|---|
|
n |
% |
n |
% |
||||||
|
Abbreviations: AUC, area under the curve; NPV, negative predictive value; PPV, positive predictive value; Se, sensitivity; Sp, specificity. |
|||||||||
|
TRAPTEM |
≤ 53 |
7 |
100.00 |
3 |
15.79 |
<0.001 |
Se: 100% Sp: 84.21% |
PPV: 70% NPV: 100% |
88.46% |
|
> 53 |
0 |
0.00 |
16 |
84.21 |
|||||
|
ARATEM |
≤ 49.5 |
7 |
100.00 |
3 |
15.79 |
<0.001 |
Se: 100% Sp: 84.21% |
PPV: 70% NPV: 100% |
88.46% |
|
> 49.5 |
0 |
0.00 |
16 |
84.21 |
|||||
|
ADPTEM |
≤ 43 |
6 |
85.71 |
1 |
5.26 |
<0.001 |
Se: 85.71% Sp: 94.74% |
PPV: 85.71% NPV: 94.74% |
92.31% |
|
> 43 |
1 |
14.29 |
18 |
94.74 |
|||||
Limitations
The major limitation of our study is the nonrandomized design. The sample size is small because of the poor affordability to this relatively costly test. Lack of gender distribution of results could be considered as another limitation as only male patients were evaluated. We did not have any provision to compare our test results with a more sensitive testing platforms like VerifyNow that has a defined high on-treatment platelet reactivity value for P2Y12 reaction assessment. Furthermore, the pharmacokinetic analysis of drug levels in blood was not performed in this study. Hence, precise correlation with the observed effects of the drugs is not possible. We observed from our study on 26 patients undergoing on-pump CABG that AUC is a sensitive marker for amount of blood component transfusions, especially the ADP agonist. In a severely stenosed artery, it is shear-gradient-dependent platelet aggregation mechanism that drives thrombus formation, while soluble agonists released from platelets play a secondary role, mainly in stabilizing formed aggregates. Despite this, the most commonly used tests such as the PFA and the VerifyNow still employ single agonists such as ADP or collagen to initiate platelet aggregation to determine the likelihood of arterial thrombosis, such as the PFA-100 and the VerifyNow.26, 27 These tests do not reflect arterial thrombogenesis under high shear conditions. When the balance is altered in favor of platelet activation and/or coagulation, or if endogenous fibrinolysis becomes less efficient, thrombosis can occur, resulting in vessel occlusion. Assessment of the true global thrombotic status therefore requires measurement of not only platelet reactivity and coagulation but also of the endogenous fibrinolytic activity. Recent evidence shows that endogenous fibrinolysis is significantly impaired in several patients with ACS and is a strong and independent predictor of recurrent adverse cardiovascular events.
Conclusion
Future tests should reflect physiological processes, and POC tests should assess nonanticoagulated blood at high shear, to reflect and assess the dynamics of thrombus formation, platelet reactivity, and thrombus stability, as well as the rate of endogenous thrombolysis of the occlusive thrombus. Algorithms should be used for right product transfuse to help prevent risk of postoperative bleeding.28 Future tests should incorporate all these features and physicians employing POC pulmonary function tests should choose the most physiological tests to best reflect the thrombotic and thrombolytic status of patients, and to better assess response to pharmacotherapy. The relatively small number of participants and the uniformity of ROTEM equipment and sample preparation method in this study prompted us to continue our efforts to overcome these issues in a larger series that is ongoing. Algorithm-based POC platelet function testing helped us to preemptively give the right blood component therapy, avoiding fibrinolytic bleeding in the postoperative period.
Conflict of Interest
None declared.
References
- The independent association of massive blood loss with mortality in cardiac surgery. Transfusion. 2004;44(10):1453-1462.
- [Google Scholar]
- Coagulation disorders of cardiopulmonary bypass: a review. Intensive Care Med. 2004;30(10):1873-1881.
- [Google Scholar]
- Major bleeding, transfusions, and anemia: the deadly triad of cardiac surgery. Ann Thorac Surg. 2013;96(2):478-485.
- [Google Scholar]
- Platelet activation and aggregation during cardiopulmonary bypass. Anesthesiology. 1991;75(3):388-393.
- [Google Scholar]
- Decreased platelet number and function and increased fibrinolysis contribute to postoperative bleeding in cardiopulmonary bypass patients. Thromb Haemost. 1988;59(1):62-67.
- [Google Scholar]
- Management of severe perioperative bleeding: guidelines from the European Society of Anaesthesiology. Eur J Anaesthesiol. 2013;30(6):270-382.
- [Google Scholar]
- Thienopyridines resistance and recovery of platelet function after discontinuation of thienopyridines in cardiac surgery patients. Eur J Cardiothorac Surg. 2014;45(1):165-170.
- [Google Scholar]
- Near-patient platelet function testing in patients undergoing coronary artery surgery: a pilot study. Anaesthesia. 2011;66(2):97-103.
- [Google Scholar]
- Increased mortality, postoperative morbidity, and cost after red blood cell transfusion in patients having cardiac surgery. Circulation. 2007;116(22):2544-2552.
- [Google Scholar]
- Point-of-care testing: a prospective, randomized clinical trial of efficacy in coagulopathic cardiac surgery patients. Anesthesiology. 2012;117(3):531-547.
- [Google Scholar]
- The laboratory evaluation of platelet dysfunction. Clin Lab Med. 2002;22(2):405-420.
- [Google Scholar]
- 2002:459-470. In vitro assays for evaluating platelet function. In: Gresele P, Page C, Fuster V, Vermylen J, eds. Platelets in Thrombotic and Non-thrombotic Disorders. Cambridge: Cambridge University Press
- 2002:297-315. Flow cytometry. In: Michelson AD, ed. Platelets. San Diego: Academic Press
- Multiple electrode whole-blood aggregometry and bleeding in cardiac surgery patients receiving thienopyridines. Ann Thorac Surg. 2011;91(1):123-129.
- [Google Scholar]
- Balancing the benefit and risk of oral antiplatelet agents in coronary artery bypass surgery. Ann Thorac Surg. 2005;80(2):768-779.
- [Google Scholar]
- Reexploration can be deterred by point-of-care testing in cardiac surgery patient. J Card Crit Care TSS. 2017;1:48-50.
- [Google Scholar]
- Acute clopidogrel use and outcomes in patients with non-ST-segment elevation acute coronary syndromes undergoing coronary artery bypass surgery. J Am Coll Cardiol. 2006;48(2):281-286.
- [Google Scholar]
- Platelet aggregometry interpretation using ROTEM - PART - II. Ann Card Anaesth. 2016;19(4):584-586.
- [Google Scholar]
- Whole blood platelet aggregation determined by the ROTEM platelet equipment; reference intervals and stability. Platelets. 2019;1595562
- [CrossRef] [Google Scholar]
- Does preoperative platelet function predict bleeding in patients undergoing off pump coronary artery bypass surgery? J Interv Cardiol. 2015;28(3):223-232.
- [Google Scholar]
- Preoperative platelet function predicts perioperative bleeding complications in ticagrelor-treated cardiac surgery patients: a prospective observational study. Br J Anaesth. 2016;117(3):309-315.
- [Google Scholar]
- Postoperative bleeding in coronary artery bypass patients on double antiplatelet therapy: predictive value of preoperative aggregometry. Eur J Cardiothorac Surg. 2017;52(5):901-908.
- [Google Scholar]
- Bleeding risk assessment in patients undergoing elective cardiac surgery using ROTEM(®) platelet and Multiplate(®) impedance aggregometry. Anaesthesia. 2016;71(6):636-647.
- [Google Scholar]
- Individual variations of platelet inhibition after loading doses of clopidogrel. J Intern Med. 2002;252(3):233-238.
- [Google Scholar]
- Thrombotic regulation from the endothelial cell perspectives. Arterioscler Thromb Vasc Biol. 2018;38(6):e90-e95.
- [Google Scholar]
- A shear gradient-dependent platelet aggregation mechanism drives thrombus formation. Nat Med. 2009;15(6):665-673.
- [Google Scholar]
- Utility of Platelet Function Tests: A Recent Review Round Up. J Card Crit Care TSS (3):24-27.
- [Google Scholar]