Translate this page into:
Vasoactive Inotropic Score and Outcome Assessment in Cyanotic Infants after Cardiovascular Surgery
Sachin Talwar, MCh Department of Cardiothoracic and Vascular Surgery All India Institute of Medical Sciences, Ansari Nagar East, New Delhi 10029 India sachintalwar@hotmail.com
This article was originally published by Thieme Medical and Scientific Publishers Private Ltd. and was migrated to Scientific Scholar after the change of Publisher.
Abstract
Objective Prospective assessment of vasoactive inotropic score (VIS) for predicting postoperative outcomes in cyanotic infants following open-heart surgery.
Methods In this prospective observational study, postoperative outcomes were analyzed in 100 cyanotic infants operated between September 2014 and April 2016. Inotropic score and VIS were calculated at 1 hour, 24 hours, and 48 hours following surgery.
Results Mean age at surgery was 7.39 ± 4.4 months (3 days–12 months, median 9 months). Surgical procedures included repair of total anomalous pulmonary venous connection (n = 40), tetralogy of Fallot (n = 24), double outlet right ventricle with pulmonary stenosis (n = 4), bidirectional superior cavopulmonary anastomosis (n = 19), and miscellaneous (n = 13). On regression analysis, prolonged intensive care unit and hospital stay correlated best with VIS at 48-hour interval (R 2 = 0.67 and 0.50 respectively, p > 0.001). Low birth weight (< 2.5 kg), preoperative ventilation and high first-hour VIS score (> 25) were predictive of higher postoperative mortality. Maximum VIS at 24 and 48 hours were positively correlated with adverse postoperative outcomes (p < 0.001).
Conclusion In cyanotic infants undergoing open-heart surgery, higher 48-hour VIS was associated with poor postoperative outcome indicating its utility as a valuable tool in predicting postoperative outcomes.
Keywords
cardiovascular surgery
cyanotic infants
outcome assessment
vasoactive inotropic score

Introduction
Infants undergoing open-heart surgery with cardiopulmonary bypass (CPB) support are at an increased risk of morbidity and mortality.1 However, in the last few decades, improvement in surgical and perioperative management has helped to improve outcomes.1, 2 Objective scoring systems may help to predict outcomes and to compare surgical modalities and treatment protocols in the early postoperative period.3, 4 An ideal outcome measure should be easily measurable, reproducible, and most importantly independently co-relatable with short and long-term outcomes.5, 6
In 1995, Wernovsky et al proposed inotropic score (IS) in the Boston circulatory arrest study7 to quantify the amount of pharmacologic cardiovascular support required during the postoperative period. IS has been used in other clinical studies as a measurement of illness severity.3, 8, 9 In 2010, Gaies et al proposed expanding the IS to include other commonly used vasoactive medications, such as milrinone, vasopressin, and norepinephrine, and called it a vasoactive inotropic score (VIS).10 In their study, a higher VIS was associated with postoperative morbidity and mortality in patients > 6 months of age undergoing open-heart surgery with CPB support. However, limited data are available to support the use of either scoring system as a predictor of outcomes in the pediatric intensive care unit (ICU).7, 8, 9, 10
We performed this study to determine the role of VIS in predicting postoperative outcome of infants undergoing open-heart surgery for cyanotic congenital heart disease.
Patients and Methods
Between September 2014 and April 2016, 100 patients, 1 year of age or less undergoing surgery for cyanotic congenital heart disease were prospectively studied. We excluded premature infants with gestational age less than 34 weeks and weight less than 1.5 kg at surgery. Informed consent was obtained from the parents of all patients, and the study protocol was duly approved by the institutional ethics committee (IESC/T-319/08.08.2014).
The diagnosis and delineation of cardiac anatomy was established by transthoracic echocardiography, and if needed, by cardiac catheterization. Preoperative demographic and clinical data were recorded. Intraoperative data included details of the operation, use of inotropic and vasoactive medications, CPB, aortic cross clamp, and circulatory arrest times. Inotropic and vasoactive medications were initiated in the operating room as per standard protocol. These were modified in the ICU depending on the hemodynamic status by the attending surgeon and the ICU team. The hourly doses of the following inotropic and vasoactive medications were recorded: dopamine, dobutamine, epinephrine, norepinephrine, milrinone, and vasopressin.
The IS was calculated as described by Wernovsky et al7:
Wernovsky IS = dopamine dose (μg/kg/min) + dobutamine dose (μg/kg/min) + 100 × epinephrine dose (μg/kg/min).
The VIS was calculated as described by Gaies et al10:
Gaies VIS = IS +10 × milrinone dose (μg/kg/min) + 10,000 × vasopressin dose (U/kg/min) + 100 × norepinephrine dose (μg/kg/min),
These scores were obtained at five separate time periods—before surgery, within 1 hour of the completion of surgery, 24 hours after the completion of surgery, 48 hours after the completion of surgery, and just before discharge from the ICU. The maximum IS and VIS for both the first 24 hours and the subsequent 24 hours were calculated.
The following parameters were recorded: time for peripheral rewarming (hours) > 32°C, serum lactate levels, time to first negative fluid balance (hours), for every 12-hour interval, output including both urine output and chest tube drainage, time to first extubation (hours), ICU stay (days), and length of hospital stay (days).
Patient’s Characteristics
Out of the 100 patients, 85 were male. Mean age at surgery was 7.39 months ± 4.4 months (range 3 days to 12 months, median 9 months). Mean birth weight was 2.65 kg ± 0.39 kg (1.5–3.5 kg, median 2.6 kg), while mean weight at surgery was 5.28 kg ± 1.68 kg (1.5–9 kg, median 5.4 kg). The diagnoses are listed in Table 1. The most common diagnosis was total anomalous pulmonary venous connection.
|
Diagnosis |
Number (n = 100) |
|---|---|
|
Abbreviations: DORV, double outlet right ventricle; MA, mitral atresia; PA, pulmonary atresia; PS, pulmonary stenosis; PTA, persistent truncus arteriosus; TA, tricuspid atresia; TAPVC, total anomalous pulmonary venous connection; TOF, tetralogy of fallot; VSD, ventricular septal defect. |
|
|
TAPVC |
40 |
|
TOF |
24 |
|
DORV VSD PS |
4 |
|
VSD PS |
3 |
|
PTA |
5 |
|
Hemitruncus |
1 |
|
Others |
4 |
|
Single ventricle |
19 |
|
MA = 2 |
|
|
TA PA = 2 |
|
|
DORV TA = 1 |
|
|
VSD PS = 2 |
|
|
TA VSD PS = 8 |
|
|
DORV VSD PS = 4 |
|
Cyanosis at birth was present in 72 patients, 16 had cyanosis between the first week of life and second month, while 12 had cyanosis beyond this period. Thirteen patients were admitted with cardiorespiratory failure requiring preoperative ventilatory support.
Surgical Strategy
Standard anesthesia techniques were used in all patients. Eighty-one patients with diagnoses amenable to biventricular repair underwent intracardiac repair using standard methods under CPB with a period of cardioplegic arrest. In these patients, standard moderately hypothermic (32°C) CPB was used. Patients with diagnoses not amenable to biventricular repair (n = 18) underwent the bidirectional superior cavopulmonary anastomosis (BCPA) under normothermic CPB without cardioplegic arrest.
Statistical Analysis
Data were analyzed with Stata 14.0 statistical software (StataCorp LP). Categorical data are expressed as frequency and percentage, quantitative data following normal distribution are expressed as mean ± standard deviation [SD]. Quantitative data following a skewed distribution are expressed as median (minimum–maximum). Spearman correlation coefficient was used to establish correlation between variables. Multivariate regression analysis was used to predict the relationship between ICU stay and hospital stay with various VIS scores taken at 1 hour, 24 hours, and 48 hours. A p value > 0.05 was considered statistically significant.
Results
Mean CPB time was 78.4 ± 39.3 minutes (23–339, median 69 minutes) and mean aortic cross clamp time was 39.8 ± 24.1 minutes (5–95, median 42 minutes).Thirteen procedures were performed on CPB without arresting the heart. VIS in the operating room was 7.57 ± 5.60 (0–30, median 5). No inotropes were required in 17 patients. Mean VIS at 1 hour, 24 hours, and 48 hours was 15.07, 13.5, and 8.02, respectively. We divided all our patients into five groups based on VIS at various time intervals. The classification system we used was as proposed by Gaies et al10 (Table 2).
|
Group |
VIS in first 24 h |
VIS 24–48 h |
|---|---|---|
|
Abbreviation: h, hour; VIS, vasoactive inotropic score. |
||
|
1 |
<10 |
<5 |
|
2 |
10–14 |
5–9 |
|
3 |
15–19 |
10–14 |
|
4 |
20–24 |
15–19 |
|
5 |
≥25 |
≥20 |
At time intervals of 1 hour, 24 hours, and 48 hours, the number of patients in group 1 increased from 36 to 56, while that in group 5 decreased from 28 to 16 (Table 3), but even at the end of 48 hours, a significant number of patients had high inotropic requirement (VIS > 20).
|
Groups |
VIS 1 h (no.) |
VIS 24 h (no.) |
VIS 48 h (no.) |
|---|---|---|---|
|
Abbreviation: h, hour; VIS, vasoactive inotropic score. |
|||
|
1 |
36 |
54 |
56 |
|
2 |
18 |
6 |
9 |
|
3 |
13 |
7 |
9 |
|
4 |
5 |
8 |
6 |
|
5 |
28 |
23 |
16 |
Based on our institute protocol and ICU team clinical decision, inotropes were tapered off according to each patient’s clinical condition. The mean duration of mechanical ventilatory support was 28.9 ± 39.5 hours (range, 4–228 hours, median 12 hours), with mean time to negative balance 12.5 ± 16.2 hours (range, 1–90 hours, median 6 hours) and mean peak lactate 3 ± 2.13 mEq/L (range, 1–10 mEq/L, median 2.1 mEq/L), and mean time to peripheral rewarming was 11.5 ± 15.1 hours (range, 1–102 hours, median 6 hours). Based on Spearman analysis, we found that maximum VIS at 24 and 48 hours were positively correlated with adverse outcome variables (intubation time, time to negative balance, and peak lactate levels) with p value > 0.001 (Table 4 Table 5 Table 6 Table 7 Table 8).
|
Group |
ICU stay (mean ± SD) |
Hospital stay (mean ± SD) |
Intubation time (mean ± SD) |
Time to negative balance (mean ± SD) |
Peak lactate (mean ± SD) |
|---|---|---|---|---|---|
|
Abbreviations: ICU, intensive care unit; SD, standard deviation. Note: Figures in parentheses indicate 95% confidence intervals. |
|||||
|
1 (n = 36) |
1.98 ± 0.97 |
6.16 ± 1.96 |
8.08 ± 6.83 |
3.97 ± 2.57 |
1.46 ± 0.48 |
|
2 (n = 18) |
2.27 ± 1.07 |
7.00 ± 3.48 |
14.7 ± 21.2 |
8.5 ± 12.2 |
2.03 ± 0.94 |
|
3 (n = 13) |
5.34 ± 4.45 |
11.4 ± 8.15 |
48.7 ± 62.8 |
19.5 ± 24.1 |
3.85 ± 2.32 |
|
4 (n = 5) |
3.4 ± 1.14 |
8.8 ± 2.58 |
32.8 ± 24.2 |
11.8 ± 4.81 |
2.9 ± 1.02 |
|
5 (n = 27) |
7.64 ± 3.03 |
17.9 ± 9.9 |
67.6 ± 40.1 |
25.9 ± 18.5 |
5.2 ± 1.98 |
|
Group |
ICU stay |
Hospital stay |
Intubation time |
Time to negative balance |
Peak lactate |
|
1 Reg coff (cf) (n = 36) |
1 |
1 |
1 |
1 |
1 |
|
2 (n = 18) |
0.29 (–1.07, 1.66) |
0.83 (–2.79, 4.45) |
6.69 (–11.60, 25.06) |
4.52 (–3.42, 12.4) |
0.56 (–0.25, 1.39) |
|
3 (n = 13) |
3.36 (1.82, 4.89) |
5.29 (1.23 9.35) |
40.6 (20.09, 61.27) |
15.56 (6.65, 24.48) |
2.38 (1.46, 3.31) |
|
4 (n = 5) |
1.14 (–0.85, 3.67) |
2.63 (–3.35, 8.62) |
24.71 (–5.65, 55.04) |
7.82 (–5.32, 20.97) |
1.43 (0.06, 2.80) |
|
5 (n = 27) |
5.66 (4.45, 6.86) |
11.7 (8.59, 14.99) |
59.17 (41.13, 77.22) |
21.98 (14.52, 29.43) |
3.79 (3.07, 4.52) |
|
R 2 |
52.1% |
39.2% |
37.3% |
30.6% |
56.1% |
|
Group |
ICU stay (mean ± SD) |
Hospital stay (mean ± SD) |
Intubation time (mean ± SD) |
Time to negative balance (mean ± SD) |
Peak lactate (mean ± SD) |
|---|---|---|---|---|---|
|
Abbreviations: ICU, intensive care unit; SD, standard deviation. Note: Figures in parentheses indicate 95% confidence intervals. |
|||||
|
1 (n = 56) |
1.94 ± 0.84 |
6.22 ± 1.88 |
8.44 ± 6.08 |
4.46 ± 2.85 |
1.61 ± 0.61 |
|
2 (n = 6) |
2.83 ± 0.75 |
7.33 ± 2.42 |
15.33 ± 9.17 |
7.33 ± 2.16 |
2.13 ± 1.01 |
|
3 (n = 7) |
4.7 ± 1.97 |
9.85 ± 3.02 |
48.71 ± 36. 73 |
17.42 ± 13.23 |
3.87 ± 1.68 |
|
4 (n = 8) |
6.6 ± 2.82 |
17.62 ± 5.90 |
55.42 ± 37.03 |
18.5 ± 9.53 |
3.83 ± 0.96 |
|
5 (n = 23) |
8.15 ± 3.70 |
18.43 ± 11.20 |
79.76 ± 53.84 |
32.89 ± 24.14 |
5.55 ± 1.88 |
|
Group |
ICU stay |
Hospital stay |
Intubation time |
Time to negative balance |
Peak lactate |
|
1 Reg coff (cf) (n = 56) |
1 |
1 |
1 |
1 |
1 |
|
2 (n = 6) |
0.85 (–0.96, 2.67) |
1.11 (–3.96, 6.18) |
6.88 (–16.6, 30.42) |
2.87 (–7.31, 13.05) |
0.51 (–0.48, 1.51) |
|
3 (n = 7) |
2.73 (1.03, 4.43) |
3.63 (–1.1, 8.37) |
40.2 (18.2, 62.24) |
12.96 (3.45, 22.47) |
2.25 (1.32, 3.18) |
|
4 (n = 8) |
4.64 (3.04, 6.24) |
11.40 (6.93, 15.8) |
46.98 (25.01, 68.95) |
14.03 (5.06, 23.00) |
2.21 (1.34, 3.09) |
|
5 (n = 23) |
6.17 (5.11, 7.22) |
12.2 (9.27, 15.14) |
71.32 (56.10, 86.53) |
28.43 (22.11, 34.74) |
3.93 (3.35, 4.51) |
|
R 2 |
61.8% |
47% |
53.6% |
48.7% |
67.9% |
|
Group |
ICU stay (mean ± SD) |
Hospital stay (mean ± SD) |
Intubation time (mean ± SD) |
Time to negative balance (mean ± SD) |
Peak lactate (mean ± SD) |
|---|---|---|---|---|---|
|
Abbreviations: ICU, intensive care unit; SD, standard deviation. Note: Figures in parentheses indicate 95% confidence intervals. |
|||||
|
1 (n = 56) |
1.94 ± 0.73 |
6.07 ± 1.74 |
8.37 ± 5.55 |
4.71 ± 3.54 |
1.60 ± 0.66 |
|
2 (n = 9) |
3.88 ± 1.36 |
11.22 ± 4.63 |
26.88 ± 22.2 |
9.55 ± 3.16 |
2.93 ± 0.65 |
|
3 (n = 8) |
5.94 ± 2.60 |
14.55 ± 6.22 |
41.5 ± 23.41 |
16.11 ± 7.60 |
3.80 ± 1.41 |
|
4 (n = 6) |
7.83 ± 5.15 |
17.83 ± 9.04 |
89.33 ± 74.80 |
31.66 ± 31.20 |
4.96 ± 2.10 |
|
5 (n = 11) |
8.87 ± 2.94 |
20.25 ± 11.49 |
92.18 ± 34.58 |
35.34 ± 20.43 |
5.81 ± 1.65 |
|
Group |
ICU stay |
Hospital stay |
Intubation time |
Time to negative balance |
Peak lactate |
|
1 Reg coff (cf) (n = 56) |
1 |
1 |
1 |
1 |
1 |
|
2 (n = 9) |
1.94 (0.52, 3.36) |
5.15 (1.02, 9.27) |
18.51 (1.28, 35.74) |
4.84 (–3.23, 12.96) |
1.33 (0.55, 2.10) |
|
3 (n = 8) |
3.99 (2.57, 5.41) |
8.48 (4.34, 12.60) |
33.12 (14.99, 51.25) |
11.3 (3.27, 19.52) |
2.19 (1.42, 2.97) |
|
4 (n = 6) |
5.88 (4.18, 7.58) |
11.7 (6.83, 16.69) |
80.95 (60.35, 101.56) |
26.95 (17.23, 36.67) |
3.36 (2.44, 4.28) |
|
5. (n = 11) |
6.92 (5.80, 8.05) |
14.17 (10.92, 17.43) |
83.80 (67.98, 99.62) |
30.64 (23.88, 37.40) |
4.21 (3.60, 4.82) |
|
R 2 |
67.2% |
50.4% |
64.7% |
53.2% |
71.1% |
|
Groups |
VIS 1 h |
VIS 24 h |
VIS 48 h |
|---|---|---|---|
|
Abbreviations: COD, coefficient of determination; h, hour; ICU, intensive care unit; VIS, vasoactive inotropic score. |
|||
|
1 |
1 |
1 |
1 |
|
2 |
0.29 (–1.07, 1.66) |
0.85 (–0.96, 2.67) |
1.94 (0.52, 3.36) |
|
3 |
3.36 (1.82, 4.89) |
2.73 (1.03, 4.43) |
3.99 (2.57, 5.41) |
|
4 |
1.14 (–0.85, 3.67) |
4.64 (3.04, 6.24) |
5.88 (4.18, 7.58) |
|
5 |
5.66 (4.45, 6.86) |
6.17 (5.11, 7.22) |
6.92 (5.80, 8.05) |
|
R 2 (COD) |
0.52 |
0.61 |
0.67 |
|
Groups |
VIS 1 h |
VIS 24 h |
VIS 48 h |
|---|---|---|---|
|
Abbreviations: COD, coefficient of determination; h, hour; VIS, vasoactive inotropic score. |
|||
|
1 |
1 |
1 |
1 |
|
2 |
0.83 (–2.79, 4.45) |
1.11 (–3.96,6.18) |
5.15 (1.02, 9.27) |
|
3 |
5.29 (1.23, 9.35) |
3.63 (–1.1, 8.37) |
8.48 (4.34, 12.60) |
|
4 |
2.63 (–3.35, 8.62) |
11.40 (6.93, 15.8) |
11.7 (6.83, 16.69) |
|
5 |
11.7 (8.59, 14.99) |
12.2 (9.27, 15.14) |
14.17 (10.92, 17.43) |
|
R 2 (COD) |
0.39 |
0.34 |
0.50 |
After surgery, blood transfusion was required in 44 patients with mean transfused blood volume of 132.1 ± 124.90 mL (range, 50–1,300 mL, median 20 mL). Mean ICU stay was 98 ± 81.1 hours (range, 24–432 hours, median 60 hours) with mean hospital stay of 10.3 ± 7.94 days (range, 4–45 days, median 7 days). On logistic regression analysis, VIS at 48 hours correlated best in predicting ICU and hospital stay (Table 7 Table 8 Table 9).
|
Group |
VIS at 48 h |
ICU stay |
Hospital stay |
|---|---|---|---|
|
Abbreviations: h, hour; ICU, intensive care unit; VIS, vasoactive inotropic score. |
|||
|
1 |
>5 |
1 |
1 |
|
2 |
5–9 |
1.94 |
5.15 |
|
3 |
10–14 |
3.99 |
8.48 |
|
4 |
15–19 |
5.88 |
11.7 |
|
5 |
≥20 |
6.92 |
14.17 |
Patients in group 2 were likely to have ICU stay longer by 1.94 days than the group 1 patients were, similarly groups 3, 4, and 5 patients were likely to have longer ICU stay by 3.99, 5.88, and 6.92 days, respectively, than group 1 patients were (Table 7).
Similarly by regression analysis for hospital stay (Table 8), we found patients in group 2 were likely to stay longer by 5.15 days than the group 1 patients, while groups 3, 4, and 5 patients were likely to have longer hospital stay by 8.48, 11.7, and 14.1 days, respectively, than group 1 patients were (Figs. 1 and 2).

- Scatter plot showing correlation of various parameters with VIS. VIS, vasoactive inotropic score.
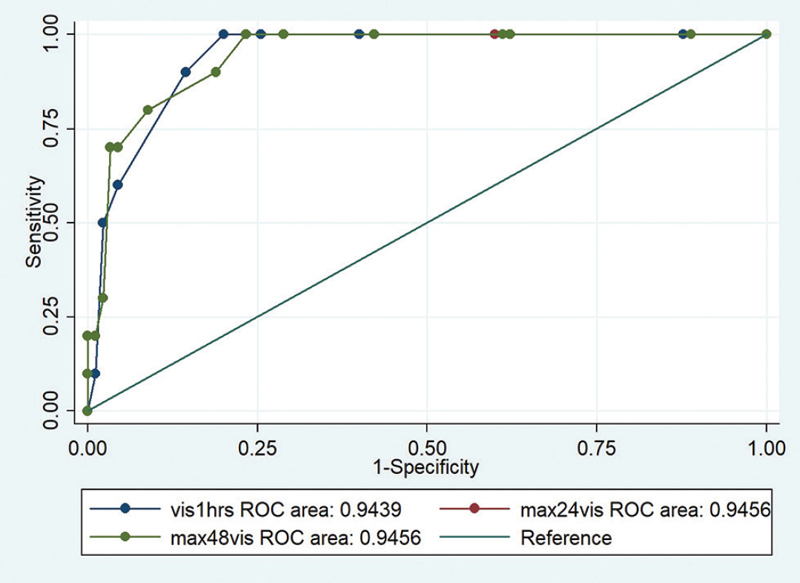
- Roc curve showing comparisons and mortality. ROC, receiver-operating characteristic.
There were 10 early deaths (Table 9). Low birth weight (> 2.5 kg) and preoperative ventilator requirement was seen to be commonly associated with poor outcome. Common causes of death were pulmonary hypertensive crisis, pulmonary hemorrhage, and acute renal failure.
Ninety patients were discharged from the ICU after mean stay of 4 days. Non-fatal complications were seen in 24 patients and included recurrent lung collapse requiring prolonged ventilator support (n = 5), chylothorax (n = 2), wound infection (n = 7), and sternal complications requiring refixation or strapping (n = 4), acute renal failure necessitating peritoneal dialysis (n = 2). Rhythm disturbances such as tachy- and bradyarrhythmias were noted in six patients.
Discussion
To the best of our knowledge, this is the first prospective study to assess the application and validation of VIS in infants with cyanotic heart disease. Infants with cyanotic heart disease have a higher postoperative mortality compared with those who are older and those with acyanotic heart disease. Surgical principles and post-operative management strategies have evolved over the past few decades leading to improvement in patient outcomes. A reliable scoring system that can predict hospital course can be of tremendous help to the surgical and ICU team as they can counsel the family members, compare various protocols, and determine effects of various interventions.
Gaies et al10 in 2010 proposed VIS in a study group of 174 infants (0–6 months), and they found that maximum VIS score at 48 hours predicts poor outcome, prolonged intubation time, longer ICU stay, and increased time to achieve negative fluid balance. In the last few years, some more authors8, 9 have validated these findings. However, no study is available on patients with cyanotic congenital heart disease undergoing open-heart surgery. In addition, there is no consensus on the single most important score, as VIS has been analyzed at varying time intervals. In this study, we attempted to obtain VIS at various time intervals and to determine which of these scores correlate best with postoperative outcomes. Gaies et al10 analyzed the maximum and mean values of VIS at 24 and 48 hours; we, however, assessed absolute values of VIS at 1, 24, and 48 hours. We observed that analyzing absolute values is not only convenient, but also practical, as it does not take into account the initial period of low cardiac output immediately after surgery. Similar findings were proposed by Davidson et al.9
Gaies et al10 proposed a classification system of inotropic score (Table 2) in their study; we extended this work and classified our patients in five groups (Table 3). We performed regression analysis on this and assessed VIS scores at 1, 24, and 48 hours with ICU stay and hospital stay. We found that VIS score at 48 hours correlated best in predicting prolonged ICU and hospital stay (Table 6).
So if a child at the end of 48 hours postoperatively has VIS score of 11 (group 3), he or she is likely to stay 3.99 days more in ICU than a group 1 child, similarly hospital stay would be 8.48 days more than the child with score less than 5 (group 1) at the end of 48 hours.
Davidson et al9 first started using the 48 hours VIS value and highlighted its importance as marker of prolonged high intensity therapy. They showed relation of VIS at 48 hours with ICU and hospital stay. They published results of 70 infants (> 3 months of age), but the group was heterogonous as they included only acyanotic patients undergoing surgery without CPB. In contrast to our study, they found relation of only intubation time with maximum VIS at 48 hours. We, however, found that all three poor prognostic variables (intubation time, time to negative balance, and peak lactate levels) were related to the maximum VIS at 48 hours (p > 0.0001).
Study Limitations
Although we have prospectively analyzed a homogenous group, ours is a single-center study, with multiple surgeons contributing to the study. Hence, surgeon-related variations cannot be ruled out. Moreover, for universal application of VIS across various age groups and diagnoses, studies involving larger numbers of patients in multiple set-ups are needed.
Conclusion
Maximum VIS at 24 and 48 hours correlates with poor outcome variables such as intubation time, peak lactate, and time to negative balance (Tables 10 and 11). However, the absolute value of VIS at 48 hours correlates best with prolonged ICU and hospital stay.
|
S no. |
Diagnosis |
Age |
Birth weight |
Preoperative ventilation |
Cause |
|---|---|---|---|---|---|
|
Abbreviations: ARDS, acute respiratory distress syndrome; ARF, acute renal failure; d, days; ECMO, extracorporeal membrane oxygenation; H/o, history of; IC, intracardiac type; IUGR, intrauterine growth restriction; LCOS, low cardiac output syndrome; mo, months; MR, mitral regurgitation; PAH, pulmonary hypertension; SC, supracardiac type; TAPVC, total anomalous pulmonary venous connection; TR, tricuspid regurgitation. |
|||||
|
1 |
SC TAPVC (obstructed) |
9 mo |
2.4 kg |
Y |
Severe biventricular dysfunction, sepsis |
|
2 |
IC TAPVC (Obstructed) |
15 d |
2.2 kg |
Y |
PAH crisis, ARF |
|
3 |
Cardiac TAPVC |
2 mo |
2.1 kg |
N |
PAH crisis, LCOS |
|
4 |
Mixed TAPVC |
3 mo |
2.1 kg |
Y |
Pulmonary hemorrhage |
|
5 |
IC TAPVC (Obstructed) |
1 mo |
2.5 kg |
Y |
Left pulmonary stenosis, LCOS, ECMO 40 hours |
|
6 |
SC TAPVC (obstructed) |
3 d |
1.9 kg |
N |
ARF, sepsis |
|
7 |
Pulmonary atresia, severe TR |
7 d |
3.2 kg |
Y |
LCOS |
|
8 |
Type 2 Truncus |
5 mo |
2.5 kg |
N |
PAH crisis, pulmonary hemorrhage, severe MR |
|
9 |
SC TAPVC (obstructed) |
2 mo |
2.5 kg |
Y |
PAH crisis, LCOS |
|
10 |
IC TAPVC |
12 d |
1.5 kg |
N |
ARDS, sepsis, H/o IUGR |
|
Group |
VIS at 48 h |
ICU stay |
Hospital stay |
|---|---|---|---|
|
Abbreviations: h, hour; ICU, intensive care unit; VIS, vasoactive inotropic score. |
|||
|
I |
>5 |
1 |
1 |
|
II |
5–9 |
1.94 |
5.15 |
|
III |
10–14 |
3.99 |
8.48 |
|
IV |
15–19 |
5.88 |
11.7 |
|
V |
≥20 |
6.92 |
14.17 |
Note
Presented at the 64th Annual Conference of the Indian Association of Cardiovascular and Thoracic Surgeons, Vizag, February 1–4, 2018.
None of the authors has any potential conflicts.
References
- Changing mortality in congenital heart disease. J Am Coll Cardiol. 2010;56(14):1149-1157.
- [Google Scholar]
- Prevalence, treatment, and outcome of heart disease in live-born children: a prospective analysis of 91,823 live-born children. Pediatr Cardiol. 1989;10(4):205-211.
- [Google Scholar]
- Comparison of maximum vasoactive inotropic score and low cardiac output syndrome as markers of early postoperative outcomes after neonatal cardiac surgery. Pediatr Cardiol. 2012;33(4):633-638.
- [Google Scholar]
- Serum lactate level has prognostic significance after pediatric cardiac surgery. J Cardiothorac Vasc Anesth. 2006;20(1):43-47.
- [Google Scholar]
- Technical performance scores in congenital cardiac operations: a quality assessment initiative. Ann Thorac Surg. 2012;94(4):1317-1323, discussion 1323.
- [Google Scholar]
- Measurement of technical performance in congenital heart surgery: a pilot study. Ann Thorac Surg. 2007;83(1):179-184.
- [Google Scholar]
- Postoperative course and hemodynamic profile after the arterial switch operation in neonates and infants. A comparison of low-flow cardiopulmonary bypass and circulatory arrest. Circulation. 1995;92(8):2226-2235.
- [Google Scholar]
- Vasoactive-inotropic score as a measure of pediatric cardiac surgical outcomes. Pediatr Crit Care Med. 2010;11(2):307-308.
- [Google Scholar]
- Prospective validation of the vasoactive-inotropic score and correlation to short-term outcomes in neonates and infants after cardiothoracic surgery. Intensive Care Med. 2012;38(7):1184-1190.
- [Google Scholar]
- Vasoactive-inotropic score as a predictor of morbidity and mortality in infants after cardiopulmonary bypass. Pediatr Crit Care Med. 2010;11(2):234-238.
- [Google Scholar]