Translate this page into:
Effect of Intraoperative Red Cell Volume Reduction on Cardiopulmonary Bypass in Cyanotic Heart Disease Patients with High Hematocrit: A Prospective Randomized Control Trial
*Corresponding author: Prasanta Kumar Das, Department of Anaesthesiology and Critical Care, All India Institute of Medical Sciences, Bhubaneswar, Odisha, India. docdas.aiims@gmail.com
-
Received: ,
Accepted: ,
How to cite this article: Das PK, Das S, Airan B, Kiran U, Chauhan S, Makhija N, et al. Effect of intraoperative red cell volume reduction on cardiopulmonary bypass in cyanotic heart disease patients with high hematocrit: A prospective randomized control trial. J Card Crit Care TSS 2023;7:87-94.
Abstract
Objectives:
Cyanotic heart disease leads to increase in blood viscosity which may reduce tissue perfusion. Intraoperative autologous blood donation (IABD) is a technique of replacing patient’s blood with crystalloids followed by reinfusion after CPB. We studied the effect of intra-operative red cell volume reduction on CPB in cyanotic heart disease patients with high haematocrit.
Materials and Methods:
The patients were divided into two groups of 30 each. Group A received standard perioperative care without IABD, and Group B received standard care along with IABD. Post intubation, blood was collected from the central venous line in group B as per maximum allowable blood loss with a target HCT of 45%. Parameters recorded for analysis at various time points include heart rate, blood pressure, rSO2 via NIRS, pH, haematocrit, lactate, base deficit, and P/F ratio.
Results:
Demographic and baseline characteristics were comparable between the groups. Total mean perfusion flow rate was slightly lower in group A as compared to group B (p-value=0.075). There is no significant difference in perfusion pressure and line pressures except at T1 (30min in CPB) where it is lower in group B. NIRS values were higher in group B which becomes insignificant after CPB and in the ICU. Patients in group B have lower haematocrit, higher pH, lower base deficit and lower lactate levels.
Conclusion:
Reduction in haematocrit is safe and led to better tissue perfusion including cerebral perfusion both before and during CPB which was reflected by higher pH, lower lactate levels and higher NIRS value.
Keywords
Cyanotic congenital heart disease
Cardiopulmonary bypass
Polycythaemia
Red cell volume reduction
Randomised control trial

INTRODUCTION
Cyanotic heart disease is a spectrum of diseases where there is a decrease in oxygen concentration in the blood. This is due to a decrease in blood oxygenation in the lung which may be due to reduced blood flow in the pulmonary arteries or any intracardiac lesion leading to right to left shunt. This is a multisystem disorder.[1] Reduced oxygen saturation and oxygen delivery to the tissue trigger a cascade of adaptive mechanisms.[2] Increased erythropoietin stimulates the production of red blood cells in the bone marrow in response to the low oxygen content, leading to an increase in whole blood viscosity.[3] Due to chronic elevation in blood viscosity, tissue perfusion may be reduced potentially impeding oxygen delivery to the tissues.[4] These changes lead to a transient ischemic attack, stroke, and pulmonary thromboemboli.[5-7] Platelet count is usually in the lower range of normal or mildly reduced due to abnormal thrombopoiesis and reduced survival. Renal dysfunction is observed owing to hypoxia, hyperviscosity, and reduced perfusion.[8] Chronic renal hypoxia is associated with reduced glomerular filtration rate and higher plasma creatinine and urate levels.[9]
The clinical manifestations of hyperviscosity symptoms such as headache, visual disturbance, loss of concentration, paresthesia, muscle weakness, and fatigue have been attributed to polycythemia.[10] Post-operative hemorrhagic diathesis is related to the elevated hematocrit, blood viscosity, and aggregation of intravascular red cell.[11] Increases in blood viscosity causes increase in shear stress on the platelet surface which causes the production of microparticles.[12] The effect of shear stress is exaggerated in cardiopulmonary bypass (CPB).[8]
Intraoperative autologous blood donation (IABD) is a blood conservation technique that involves the removal of a portion of the patient’s blood intraoperatively with reinfusion of this blood immediately after CPB. This limits allogeneic transfusion by preserving the withdrawn blood from destruction by the CPB circuit and by providing a fresh autologous source of red blood cells, platelets, and coagulation factors for reinfusion after CPB. If blood volume is maintained, acute red cell reduction is associated with a significant increase in cardiac output and cerebral blood flow.[10] Systemic vascular resistance (SVR) decreases while stroke volume and systemic blood flow increase without a change in heart rate.[10] Decrease in blood viscosity, shear stress, and SVR improves systemic oxygen transport.[13]
Transfusion of homologous blood should be avoided as much as possible in children due to associated problems.[14] Blood is collected in a bag before CPB or heparin administration and can be transfused at the end of surgery. Pre-operative and intraoperative donations are safe and contribute to blood conservation in pediatric open-heart surgery.[15] Acute normovolemic hemodilution is a form of perioperative autotransfusion performed in patients undergoing elective surgery. This is an inexpensive and effective means of reducing allogeneic blood exposure.[16] After induction of anesthesia, blood from the patient is collected in standard sterile blood bags containing anticoagulants. Normovolemia should be maintained throughout the process.[17] They are re-transfused to the patient at the end of surgery. It decreases post-operative blood loss by providing fresh autologous red blood cells, platelets, and coagulation factors for reinfusion after CPB.[18]
Transoxygenator pressure increases to a very high level in patients with polycythemia undergoing surgery under CPB.[19] The oxygenator of the CPB circuit may malfunction, leading to the low partial pressure of oxygen and hypoxemia. Ineffective peripheral, organ, and tissue perfusion may occur with very high hematocrit. Uniform cooling and rewarming may not be possible. Excess hemolysis and acidosis may be a problem.
Hence, cardiac surgery in cyanotic heart disease patients will have good outcomes by optimizing the hematocrit. This will increase the tissue perfusion during CPB and will require less amount of homologous blood and blood component transfusion postoperatively.
Hence, with these backgrounds, we assumed that IABD will improve the organ and tissue perfusion, and metabolic parameters in congenital cyanotic heart disease patients with high hematocrit. We studied the effect of intraoperative red cell volume reduction on cardiopulmonary bypass in cyanotic heart disease patients with high hematocrit.
MATERIAL AND METHODS
The study was conducted in the Department of Cardiac Anesthesiology, All India Institute of Medical Sciences, New Delhi from August 2015 to May 2017 after getting Institutional Ethics Committee approval. This study was a prospective randomized control trial. The study was conducted after getting written and informed consent from the patients.
The sample of convenience was decided as 30 patients in each group, eight patients were excluded of which six did not meet the inclusion criteria and two patients did not provide written informed consent. The patients in the study were divided into two groups of 30 each and were randomized to one of the groups based on a computer-generated random number list [Figure 1]. Group A (control) received standard perioperative care without IABD and group B (case) received standard care along with IABD. Data were analyzed using the statistical software Stata 14.0 (college station, Texas, USA).

- Consort flow diagram.
Patients with cyanotic heart disease undergoing open heart surgery and weighing more than 10 kg with a hematocrit of more than 55% were included in the study.
Body weight <10 kg, hematocrit <55%, emergency surgery, ventricular dysfunction, patient with active infection, or any unstable patient were excluded from the study.
Autologous blood was collected from the central venous line in the study group after the intubation. The amount of blood collected was as per the maximum allowable blood loss (MABL).
MABL = (starting hematocrit [HCT]-target HCT/starting HCT) × estimated blood volume
The target HCT was 45%. The same amount of crystalloid was transfused to maintain intravascular volume. The blood was collected in sterile blood bags, labeled, and stored in a cold environment.
All the patients were kept fasting for 8 h and clear fluid was allowed until 2 h before surgery. They were pre-medicated with morphine 0.1 mg/kg and inj. Promethazine 0.5 mg/kg intramuscularly before shifting to the operation room (OR). In the OR, pulse oximetry, five lead electrocardiogram (ECG), and non-invasive blood pressure (BP) cuff were applied, then venous access was established. Patients were induced with ketamine 2 mg/kg, midazolam 0.1 mg/kg, and fentanyl 2 mcg/kg after pre-oxygenation with 100% oxygen. If the child was uncooperative, then induction was started with oxygen and sevoflurane 8% and gradually decreased. Anesthesia proceeded with the same technique as per the pre-OR IV line in situ group. Muscle relaxation was achieved with rocuronium 0.6 mg/kg. Endotracheal intubation was done with a proper size endotracheal tube and secured. An arterial line for invasive BP, a central venous catheter for central venous pressure (CVP) monitoring, and drug infusion were placed. Anesthesia was maintained with an oxygen air mixture in the ratio of 50:50 along with sevoflurane 2%, and intermittent IV midazolam. Analgesia was maintained with fentanyl and muscle relaxation with intermittent vecuronium. Ventilation was controlled with a tidal volume of 8–10 mL/kg and positive end-expiratory pressure of 0–5 mm Hg. Intraoperative monitoring includes ECG, pulse oximetry, invasive arterial BP, CVP, nasopharyngeal temperature, near-infrared spectroscopy (NIRS), transesophageal echocardiography, and urine output.
Autologous blood was collected from the patient according to MABL before heparinization. Surgery was performed by standard midline sternotomy under CPB. After systemic heparinization with 400 units/kg, the ascending aorta was cannulated with the proper size aortic cannula. For venous drainage, either bicaval cannulation or right atrial cannulation was done. CPB was instituted after target-activated clotting time >480 s was achieved. CPB proceeded with a roller pump with the use of a polyvinyl chloride circuit (Medtronics, Minneapolis, USA.), and oxygenation was achieved with the use of a hollow fiber microporous polypropylene membrane oxygenator (Capiox, Terumo Corporation, Tokyo, Japan). Perfusion flow rate (PFR) and perfusion pressure (PP) were controlled by the perfusionist as per the body surface area and temperature. Arterial blood gas (ABG) was done at regular intervals and corrected accordingly. Heart rate and BP are recorded at various time points, after induction (T0), after autologous blood donation (T1), after coming off bypass (T2), and in the intensive care unit (ICU) (T3). Hematocrit, lactate, pH, base deficit, the ratio of partial pressure of oxygen to fraction of inspired oxygen (P/F ratio), and rSO2 (regional cerebral oxygenation using NIRS monitor) recorded at different time points (at induction = T0, after IABD = T1, in CPB 15 min = T2, 30 min = T3, after the release of aortic cross-clamp = T4, post CPB = T5, in ICU = T6). On CPB, PP, PFR, and arterial line pressure (LP) are monitored and recorded in regular intervals (15 min = T0, 30 min = T1, 45 min = T2, 60 min = T3). After the completion of the surgical procedure, rewarming was done. To facilitate rewarming, sodium nitroprusside infusion was started, and to improve cardiac contractility dobutamine infusion was started and titrated. After aortic cross-clamp release, complete rewarming, and de-airing of the heart chambers, patients were weaned from CPB slowly with the resumption of mechanical ventilation. After confirming the adequacy of surgical correction, venous cannulae were removed and heparin neutralization was done with protamine. The aortic cannula was removed, hemostasis achieved, surgical closure was done, and the patient shifted to the cardiac surgical ICU. Standard treatment as per institute protocol, was given in ICU in the form of antibiotics, analgesics, and iv fluids. Patients were mechanically ventilated till they were hemodynamically stable and stabilized of post-operative bleeding. The patient’s chest tube drainage, blood, and blood component requirement were observed and recorded. Any adverse events were recorded.
RESULTS
Demographic variables were comparable in both groups (P > 0.05). The baseline heart rate in group A was 94 ± 22/min and in group B it was 99 ± 23/min. The mean arterial BP was also comparable (72.2 ± 6.8 mm of Hg in group A vs. 72.4 ± 6.3 mm of Hg in group B). The mean CPB time in group A was 98 ± 37 min and in group B was 114 ± 55 min. The aortic cross-clamp time in group A was 54 ± 30 min which was comparable to 50 ± 34 min in group B [Table 1].
| Parameters | GROUP-A (CONTROL) (N=30) | GROUP-B (CASE) (N=30) | P-VALUE |
|---|---|---|---|
| Sex | |||
| Male f (%) | 18 (60) | 26 (87) | |
| Female f (%) | 12 (40) | 4 (13) | |
| Age (years) | 8.4±5 | 8.9±4 | 0.65 |
| Weight (kg) | 20.2±12.0 | 23±11.5 | 0.29 |
| Height (cm) | 118.1±24.5 | 120.4±25.4 | 0.71 |
| BSA (m2) | 0.78±0.32 | 0.84±0.30 | 0.46 |
| Urea (mg/dL) | 29.6±12.4 | 31±14 | 0.58 |
| Creatinine (mg/dL) | 0.38±0.14 | 0.33±0.12 | 0.22 |
| HR (/min) | 94±22 | 99±23 | 0.33 |
| MAP (mmHg) | 72.2±6.8 | 72.4±6.3 | 0.87 |
| CPB (min) | 98±37 | 114±55 | 0.27 |
| AOXC (min) | 54±30 | 50±34 | 0.98 |
All parameters are expressed as Mean±SD. BSA: Body surface area, CPB: Cardiopulmonary bypass, HR: Heart rate, MAP: Mean arterial pressure, CPB: Cardiopulmonary bypass, AOXC: Aortic cross-clamp time
Baseline ABG parameters in both groups are comparable. Independent student’s t-test was used to compare pH, base deficit, hematocrit, lactate, and P/F ratio between the two groups. The P-value was found to be insignificant [Table 2]. The mean pH in group A was 7.07 ± 0.17 and in group B was 7.1 ± 0.16, the mean of BD in group A was 3.2 ± 1.18 and in group B was 3.2 ± 1.14, and the mean value of lactate in group A was 1.31 ± 0.58, in group B 1.37 ± 0.31. The mean hematocrit in group A was 62.7 ± 8.8 and in group B was 64.8 ± 7.5. The mean P/F ratio in group A was 93 ± 15 and in group B was 94 ± 9.7. There was no major difference in hematocrit level before autologous blood donation.
| ABG parameter | Control | Case | P-value |
|---|---|---|---|
| pH | 7.07±0.17 | 7.1±0.16 | 0.92 |
| BD | 3.2±1.18 | 3.2±1.14 | 0.85 |
| LAC | 1.31±0.58 | 1.37±0.31 | 0.51 |
| HCT | 62.7±8.8 | 64.8±7.5 | 0.33 |
| P/F ratio | 93±15 | 94±9.7 | 0.55 |
All parameters are expressed as Mean±SD. ABG: Arterial blood gas, BD: Base deficit, LAC: Lactate, HCT: Hematocrit, P/F ratio: Partial pressure of oxygen to fraction of inspired oxygen
The mean PFR in both the groups was analyzed by independent t-test, repeated measure analysis of variance (ANOVA). No significant difference was noted except at T3 which is 45 min in CPB [Table 3]. The minimum observed flow rate in group A was 1.6 ± 0.65 L/min/sq.m. and in group B was 1.9 ± 0.8 L/min/sq.m. Total mean PFR was slightly lower in group A as compared to group B, but this difference was statistically insignificant (P = 0.075).
| Perfusion flow rate (lit/min/sqm.) in CPB | |||||
| T0 | T1 | T2 | T3 | P-value within group | |
| Group A | 1.8±0.76 | 1.7±0.74 | 1.6±0.65 | 1.6±0.74 | <0.0001 |
| Group B | 2.1±0.77 | 1.9±0.8 | 2±0.61 | 2±0.71 | 0.003 |
| P-value | 0.108 | 0.25 | 0.02 | 0.046 | |
| P-value between groups | 0.075 | ||||
| Perfusion pressure (mmHg) in CPB | |||||
| T0 | T1 | T2 | T3 | P-value within group | |
| Group A | 46±10.5 | 55±9.9 | 49±18.6 | 48±10.2 | 0.004 |
| Group B | 44±14.1 | 48±13 | 51.8±12.2 | 47±8.7 | 0.022 |
| P-value | 0.543 | 0.018 | 0.504 | 0.655 | |
| P-value between groups | 0.075 | ||||
| Line pressure (mmHg) in CPB | |||||
| T0 | T1 | T2 | T3 | P-value within group | |
| Group A | 151±32.9 | 157±26.2 | 145±35 | 143±31.4 | 0.001 |
| Group B | 143±24.7 | 141±24.6 | 144±16.8 | 139±17.7 | 0.218 |
| P-value | 0.322 | 0.015 | 0.929 | 0.57 | |
| P-value between groups | 0.27 | ||||
All parameters are represented as Mean±SD. CPB: Cardiopulmonary bypass, P/F ratio: Partial pressure of oxygen to fraction of inspired oxygen
The PP during CPB in both the groups is compared both at each time point and as a whole [Table 3]. There was no statistically significant difference between the two groups (P = 0.075). The minimum PP in group A was 46 ± 10.5 mmHg, and in group B, it was 44 ± 14.1 mmHg. However, at time point T1 (30 min in CPB), there was a statistically significant difference (P = 0.018) when PP in group B was significantly lower than in group A.
The mean arterial LP in CPB [Table 3] shows no significant difference (P = 0.270) except at time point T1 (30 min in CPB) when the mean LP in group B was significantly (P = 0.015) lower than group A.
NIRS was monitored at the induction of anesthesia and during the surgical procedure which continued until the patient was shifted to ICU. NIRS in both the groups was recorded and analyzed with independent t-test as well as repeated measure ANOVA and the mean is shown in [Table 4]. The baseline values were comparable. There was a significant difference in NIRS value between the two groups. NIRS in group B was higher than the group which was statistically significant (P < 0.0001). NIRS value after IABD and during CPB was significantly higher than that of group A (without IABD), the difference becomes insignificant after CPB and in ICU (P = 0.485). The NIRS trend is shown in [Figure 2].
| Group | NIRS (%) | P-value within group | ||||||
|---|---|---|---|---|---|---|---|---|
| NIRS0 | NIRS1 | NIRS2 | NIRS3 | NIRS4 | NIRS5 | NIRS6 | ||
| Group A (n=30) | 60.8±5.8 | 58.4±3.9 | 66.8±8.5 | 66.9±8.2 | 72±6.7 | 74.7±3.5 | 75.9±3.2 | <0.0001 |
| Group B (n=30) | 60.6±5.2 | 66.7±5.4 | 75.9±4.6 | 75±3.2 | 76.1±3.2 | 76.4±3.6 | 76.5±3.3 | <0.0001 |
| P-value | 0.853 | <0.0001 | <0.0001 | <0.0001 | 0.004 | 0.068 | 0.485 | |
| P-value between groups | <0.0001 | |||||||
Data expressed as Mean±SD. NIRS: Near infrared spectroscopy

- Near infrared spectroscopy trend.
The comparison of blood pH between the two groups is shown in [Table 5]. The baseline pH in both groups was similar. There was a significant difference after IABD, during CPB, after CPB, and even in ICU (P < 0.0001). The minimum pH in group A was 7.0 ± 0.11, and in group B, it was 7.1 ± 0.16. There was a gradual increase in pH in both groups but obvious in group B. The serial change in pH is shown in [Figure 3].
| T0 | T1 | T2 | T3 | T4 | T5 | T6 | P-value within groups | |
|---|---|---|---|---|---|---|---|---|
| pH | ||||||||
| Group A (n=30) | 7.0±0.18 | 7.0±0.11 | 7.2±0.11 | 7.2±0.16 | 7.3±0.08 | 7.2±0.08 | 7.3±0.06 | <0.0001 |
| Group B (n=30) | 7.1±0.16 | 7.2±0.16 | 7.3±0.14 | 7.4±0.11 | 7.3±0.07 | 7.3±0.08 | 7.3±0.08 | <0.0001 |
| P-value | 0.505 | <0.0001 | <0.0001 | 0.002 | <0.0001 | <0.0001 | <0.0001 | |
| P-value between groups | <0.0001 | |||||||
| BD | ||||||||
| Group A (n=30) | 3.1±1.2 | 3.6±1.3 | 1.9±1.5 | 2.7±1.3 | 2.1±1.2 | 2.4±1.3 | 2.3±0.9 | <0.0001 |
| Group B (n=30) | 3.2±1.1 | 2.1±0.8 | 1.9±0.7 | 1.9±0.8 | 1.8±0.7 | 1.8±0.7 | 1.5±0.6 | <0.0001 |
| P-value | 0.778 | <0.0001 | 0.941 | 0.005 | 0.258 | 0.038 | <0.0001 | |
| P-value between groups | 0.001 | |||||||
| HCT | ||||||||
| Group A (n=30) | 62.7±9.0 | 57.9±10.2 | 39.0±13.7 | 38.62±11.7 | 42.7±13.7 | 43.4±9.5 | 43.2±9.1 | <0.0001 |
| Group B (n=30) | 64.8±7.6 | 52.4±9.6 | 34.4±12.8 | 36.8±9.9 | 41.4±11.6 | 40.5±10.7 | 41.2±11.4 | <0.0001 |
| P-value | 0.335 | 0.037 | 0.182 | 0.526 | 0.686 | 0.268 | 0.458 | |
| P-value between groups | 0.351 | |||||||
| LAC | ||||||||
| Group A (n=30) | 1.3±0.59 | 1.5±0.94 | 3.2±1.64 | 3.2±1.39 | 3.0±1.32 | 2.9±1.10 | 2.4±0.85 | <0.0001 |
| Group B (n=30) | 1.3±0.32 | 1.0±0.53 | 1.1±0.35 | 1.1±0.35 | 1.3±0.40 | 1.2±0.32 | 0.97±0.37 | <0.0001 |
| P-value | 0.593 | 0.02 | <0.0001 | <0.0001 | <0.0001 | <0.0001 | <0.0001 | |
| P-value between groups | <0.0001 | |||||||
| P/F ratio | ||||||||
| Group A (n=30) | 93.6±15.4 | 103.2±25.4 | 433.6±135.8 | 460.5±101.8 | 413.5±149.2 | 343.2±112.3 | 267.4±81.9 | <0.0001 |
| Group B (n=30) | 94.6±9.89 | 117.1±22.2 | 449.1±97.6 | 473.4±90.7 | 457.2±5.3 | 322.2±66.4 | 330.8±52 | <0.0001 |
| P-value | 0.774 | 0.028 | 0.614 | 0.608 | 0.141 | 0.382 | 0.001 | |
| P-value between groups | 0.054 | |||||||
Data expressed as Mean±SD. ABG: Arterial blood gas, BD: Base deficit, LAC: Lactate, HCT: Hematocrit, P/F ratio: Partial pressure of oxygen to fraction of inspired oxygen
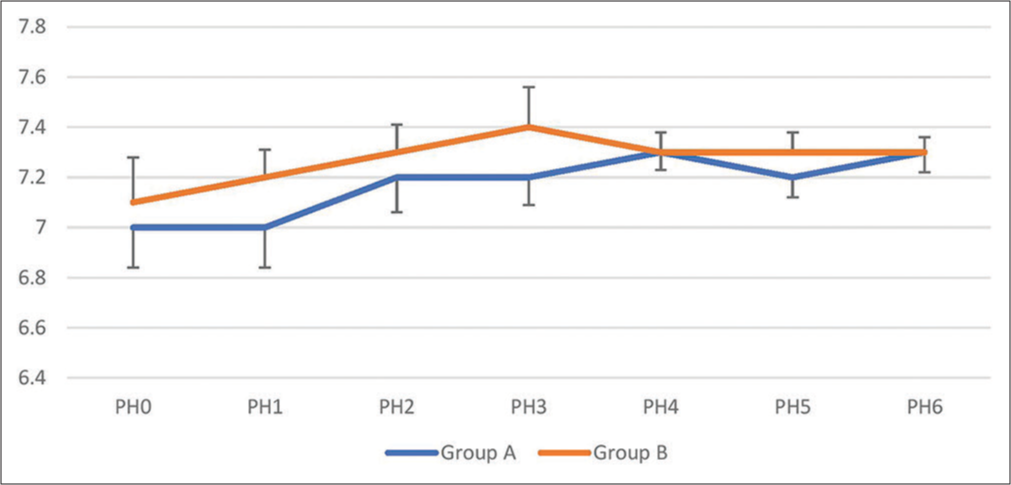
- Serial change in blood pH.
The base deficit in both groups was compared [Table 5]. The baseline values were similar in both groups. There was a statistically significant difference between the groups (P = 0.001). The student t-test showed that there is a significant difference at time points T1, T3, T5, and T6. This indicated that the base deficit was significantly lower in group B at several time points in comparison to group A. The mean and standard deviation (SD) are shown in [Figure 4].

- Base deficit.
The HCT values in both groups are analyzed by independent t-test as well as repeated measure ANOVA [Table 5]. The values are similar in both the groups both at the baseline as well as throughout the period of CPB and postoperative period. There was no significant difference between the groups (P = 0.351).
The blood lactate levels before IABD in both groups are comparable [Table 5]. There was a significant difference (P < 0.0001) between the groups. Group B had lactate levels significantly lower than group A throughout CPB and surgical procedure which continued until the patient was shifted to ICU. The serial trend in changes in lactate levels is shown in [Figure 5].
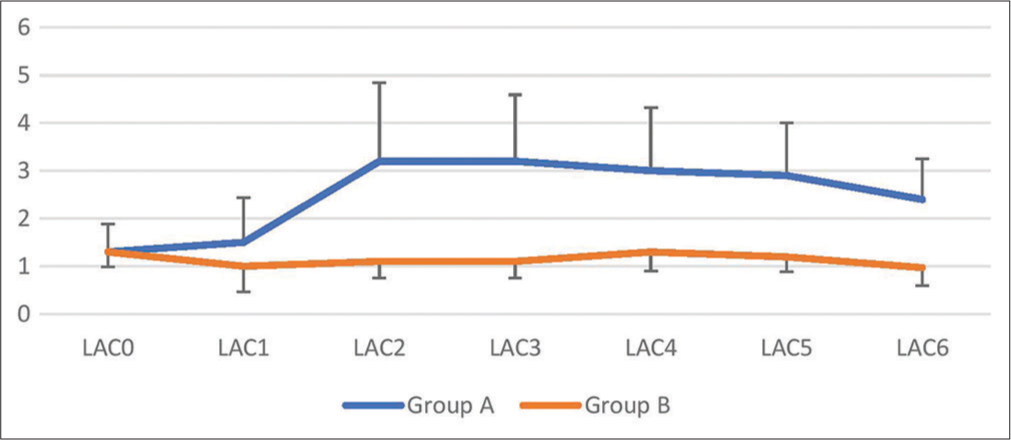
- Lactate serial trend.
There was no significant difference in the P/F ratio (P = 0.05) between the groups. However, looking at the trend of various time points P/F ratio in group B was higher than group A at time points T1, and T6 (P < 0.05). The lowest value of the mean in group A was 93.6 ± 15.4; in group B, it was 94.6 ± 9.89 which was at the baseline. The baseline value was similar in both groups [Table 5 and Figure 6].
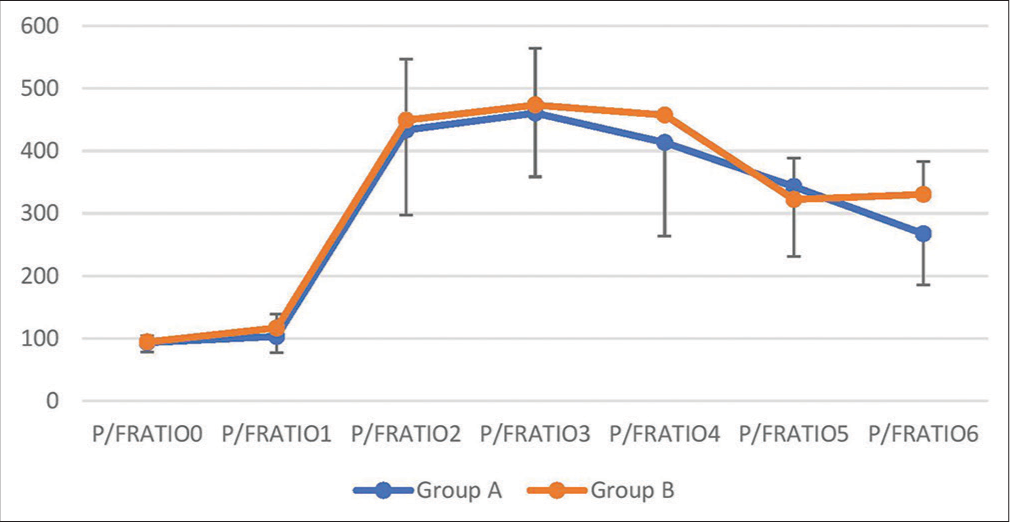
- P/F ratio serial trend.
Bleeding in the first 24 h was similar in both groups. P = 0.54. The mean bleeding in group A was 69 ± 30 mL and in group B was 75 ± 15 mL.
DISCUSSION
We studied the effect of intraoperative red cell volume reduction in cyanotic heart disease patients undergoing open heart surgery under CPB. Matched-pair analysis demonstrated that IABD is effective in improving the perfusion of cyanotic heart disease patients with high HCT during CPB. In this study, patients who underwent autologous blood donation before CPB showed improvement in tissue perfusion which was indirectly reflected by a better acid-base balance in the form of lower blood lactate levels, lower base deficit, and higher pH. By decreasing the HCT level thereby reducing the viscosity of the blood, the circulation improved both pre-CPB, during CPB, and post-CPB. No significant hemodynamic change occurred during the collection of blood, but the pH improved significantly (P < 0.0001). The base deficit was also improved significantly (P < 0.0001). During CPB, though there was no significant difference in PFR, PP, and LP. However, if we look at the serial trend, PFR in Group B is higher than in Group A. The LP was lower in group B which tells that a higher pump flow can be given with a lower LP in patients undergoing IABD before initiation of CPB.
Reduction in HCT and blood viscosity led to better tissue perfusion including cerebral perfusion which was reflected by a significantly higher NIRS value (P < 0.0001) in patients undergoing IABD. Gottlieb and Mossad in a case series found that NIRS values are accurate in cyanotic patients with polycythemia.[20] Earlier Liem et al. studied the effect of hemodilution in polycythemic newborn infants’ cerebral oxygenation and found no improvement in NIRS.[21] In our study, we found a significant difference in NIRS value after hemodilution in polycythemic patients. We studied children with more than 10 kg body weight. This may be the reason for such a difference.
We also found that the pH levels are consistently lower in patients who had undergone IABD and hemodilution. IABD improved the tissue perfusion, so decreased acidosis and a higher pH.
The base deficit was also significantly lower (P = 0.001) in patients with IABD. This may be due to better tissue perfusion after hemodilution and decreased acidosis.
In our study, we found that the blood lactate levels were also significantly lower (P < 0.0001) in the study group throughout the CPB and surgical procedure which persisted until the patient was in ICU. This further says that IABD and reduced red cell mass improves tissue perfusion, and tissue oxygenation preventing anaerobic metabolism which leads to a decrease in lactate levels.
The P/F ratio is an indicator of oxygenation in the lungs and the oxygenator during CPB. We found a significant difference (P = 0.028) in the P/F ratio among the groups just after IABD and hemodilution, but an equivocal response during CPB (P = 0.05). There was no obvious difference in oxygenation during CPB which may be due to a smaller study population.
The post-operative blood loss was not significantly different, though there was slightly higher blood loss in the study group. The mean postoperative blood loss in the study group was 75 ± 15 mL in 24 h as compared to 69 ± 30 mL in the control group.
There were no hemodynamic changes or any serious adverse events during the collection of blood and hemodilution. There was also no serious adverse event during the surgical procedure or in the postoperative period.
CONCLUSION
In our study, we studied the effect of acute red cell volume reduction on CPB in cyanotic heart disease patients with polycythemia and found that red cell volume reduction is safe. It improves tissue perfusion both before and during CPB. We conclude that red cell volume reduction in polycythemic patients improves tissue perfusion in cyanotic heart disease patients. We recommend a population study before implementing our results to the general population.
Declaration of patient consent
Patient’s consent not required as patients identity is not disclosed or compromised.
Conflicts of interest
There are no conflicts of interest.
Financial support and sponsorship
Nil.
References
- Blood conservation strategies in cardiac surgery: More is better. Eur J Cardiothorac Surg. 2014;46:865-70.
- [CrossRef] [PubMed] [Google Scholar]
- Presentation, survival prospects, and predictors of death in Eisenmenger syndrome: A combined retrospective and case-control study. Eur Heart J. 2006;27:1737-42.
- [CrossRef] [PubMed] [Google Scholar]
- Blood viscosity and its relationship to iron deficiency, symptoms, and exercise capacity in adults with cyanotic congenital heart disease. J Am Coll Cardiol. 2006;48:356-65.
- [CrossRef] [PubMed] [Google Scholar]
- Hyperviscosity in congenital heart disease. J Pediatr. 1970;76:214-20.
- [CrossRef] [PubMed] [Google Scholar]
- Risk of stroke in adults with cyanotic congenital heart disease. Circulation. 1993;87:1954-9.
- [CrossRef] [PubMed] [Google Scholar]
- Vascular occlusive episodes and venous haematocrit in primary proliferative polycythemia. Lancet. 1978;2:1219-22.
- [CrossRef] [PubMed] [Google Scholar]
- Cerebrovascular events in adult patients with cyanotic congenital heart disease. J Am Coll Cardiol. 1996;28:768-72.
- [CrossRef] [PubMed] [Google Scholar]
- Prevalence, predictors, and prognostic value of renal dysfunction in adults with congenital heart disease. Circulation. 2008;117:2320-8.
- [CrossRef] [PubMed] [Google Scholar]
- Cyanotic congenital heart disease: A multisystem disorder In: Perloff JK, Child JS, eds. Congenital Heart Disease in Adults. Philadelphia, PA: W.B. Saunders Company; 1991. p. :199-226.
- [Google Scholar]
- Management of polycythemia in adults with cyanotic heart disease. Heart. 1998;79:315-6.
- [CrossRef] [PubMed] [Google Scholar]
- Acute hemodynamic effects of red cell volume reduction in polycythemia of cyanotic congenital heart disease. Circulation. 1970;42:297-308.
- [CrossRef] [PubMed] [Google Scholar]
- Management of relative polycythemia: Studies of cerebral blood flow and viscosity. Br J Haematol. 1980;46:427-33.
- [CrossRef] [PubMed] [Google Scholar]
- Cyanotic congenital heart disease (CCHD): Focus on hypoxemia, secondary erythrocytosis, and coagulation alterations. Pediatr Anesth. 2015;25:981-9.
- [CrossRef] [PubMed] [Google Scholar]
- A new strategy for estimating risks of transfusion-transmitted viral infections based on rates of detection of recently infected donors. Transfusion. 2005;45:254-64.
- [CrossRef] [PubMed] [Google Scholar]
- Predonation of autologous blood reduces perioperative allogenic transfusion requirement in grown-up patients with congenital heart disease. Eur J Cardiothorac Surg. 2010;37:991-5.
- [CrossRef] [PubMed] [Google Scholar]
- American Society of Anesthesiologists Task Force on Blood Component Therapy: Practice guidelines for blood component therapy: A report by the American Society of Anesthesiologists Task Force on Blood Component Therapy. Anesthesiology. 1996;84:732-47.
- [CrossRef] [PubMed] [Google Scholar]
- Consensus conference on autologous transfusion. Acute normovolemic hemodilution. Transfusion. 1996;36:640-3.
- [CrossRef] [PubMed] [Google Scholar]
- Blood conservation strategies in cardiac surgery. Semin Cardiothorac Vasc Anesth. 2003;2:175-88.
- [CrossRef] [Google Scholar]
- High transoxy-genator pressure gradient in a patient with polycythemia vera. J Cardiothorac Vasc Anesth. 2010;24:104-8.
- [CrossRef] [PubMed] [Google Scholar]
- Limitations of cerebral oxygenation monitoring by near-infrared spectroscopy in children with cyanotic congenital heart disease and profound polycythemia. J Cardiothorac Vasc Anesth. 2014;28:347-9.
- [CrossRef] [PubMed] [Google Scholar]
- The effect of blood transfusion and haemodilution on cerebral oxygenation and haemodynamics in newborn infants investigated by near infrared spectrophotometry. Eur J Pediatr. 1997;156:305-10.
- [CrossRef] [PubMed] [Google Scholar]