Translate this page into:
Comparison of Systolic Time Ratio from Electrical Cardiometry Versus Echocardiography for Evaluation of Left Ventricular Systolic Function in Patients Undergoing Cardiac Surgery: A Prospective Observational Study
*Corresponding author Minati Choudhury, Professor, Department of Cardiac Anaesthesia and Critical Care, All India Institute of Medical Sciences, New Delhi, India. onlyprint0@gmail.com
-
Received: ,
Accepted: ,
How to cite this article: Singh A, Choudhury M, Chauhan S, Kapoor PM. Comparison of systolic time ratio from electrical cardiometry versus echocardiography for evaluation of left ventricular systolic function in patients undergoing cardiac surgery: A prospective observational study. J Card Crit Care TSS 2023;7:147-52.
Abstract
Objective:
To identify the correlation between systolic time ratio(STR) measured with electrical cardiometry (EC) device ICON (Osypka Medical, Berlin, Germany) and echocardiography in patients undergoing cardiac surgery and to find a noninvasive technique for estimating left ventricular systolic function during the perioperative period.
Materials and Methods:
Systolic time ratio data were obtained simultaneously from the electrical cardiometry device ICON (Osypka Medical, Berlin, Germany) and transthoracic echocardiography at the following predefined timepoints— before anaesthesia induction (T0 baseline), after induction (T1), at the end of the surgery(T2), and after extubation (T3) in patients undergoing elective cardiac surgery. The agreement between the systolic time ratio measured by electrical cardiometry and transthoracic echocardiography was studied using Bland-Altman plots. Paired t-tests were used to compare systolic time ratio measurements at different time points.
Results:
Mean STR by EC and Echocardiography at T0 was 0.456 (0.429-0.483) and 0.348 (0.330-.366) at T1 was 0.464 (0.442 -0.486) and 0.372 (0.344-0.401) at T2 was 0.421 (0.402 -0.439) and 0.305 (0.290-0.320) and at T3 was 0.438 (0.419-0.457) and 0.353 (0.336-0.370), P value <0.001. Bland-Altman analysis showed that EC measured STR compared with echocardiography at T0 with a mean bias of 0.108 and (with limits of agreement -0.19 ,0.14) at T1 it was 0.092 (with limits of agreement -0.21,0.40) at T2 it was 0.11 (with limits of agreement -0.04,0.28) and at T3 it was 0.085 (with limits of agreement -0.101 ,0.271).
Conclusion:
In conclusion, no association between systolic time ratio as measured by electrical cardiometry and echocardiography was found in our study. Our results do not conclusively prohibit using electrical cardiometry in the perioperative period to evaluate LV systolic function. Further work must be done to establish the role of STR as a surrogate marker of LV systolic function.
Keywords
Systolic time ratio
Electrical cardiometry
Echocardiography
Left ventricular systolic function
Cardiac surgery

INTRODUCTION
In patients undergoing cardiac surgery, left ventricular (LV) systolic function is an important predictor of cardiovascular outcomes.[1] Left ventricular ejection fraction (LVEF) is a commonly used measure of LV systolic function. Patients with low pre-operative LVEF represent a group with higher surgical risk. These patients have an increased risk for post-operative complications and mortality after cardiac surgery due to reduced cardiovascular reserve.[2] Therefore, early recognition of such patients is of paramount importance.
LVEF can be easily assessed by echocardiography (ECHO) in the intraoperative or intensive care setting. However, the reproducibility of LVEF has been a matter of controversy. Recently, new techniques such as tissue Doppler imaging, 3D evaluation, and speckle tracking ECHO have been proposed to quantify LV systolic function more precisely, but these methods are technically more complex, time-consuming, and user dependent.[3]
Historically, systolic time ratio (STR) was a measure in evaluating LV performance but is no longer frequently used.[4-8] STR is defined as the ratio of the pre-ejection period (the time from the onset of the QRS complex on the electrocardiogram to the opening of the aortic valve) and the LV ejection time (time from the aortic valve opening to the aortic valve closing).
STR can be measured by the ICON monitor (Osypka Medical, Berlin, Germany), which uses the principle of electrical cardiometry (EC) and can also be measured by pulse Doppler ECHO.[9] Thoracic electrical bioimpedance (TEB)-based EC measures cardiac output (CO) and other hemodynamic parameters noninvasively.[10] For this purpose, four surface electrocardiogram electrodes are attached to the left side of the neck and the lower thorax (approximately at the level of the xiphoid process). An alternating electrical current (AC) of constant amplitude is applied through the pair of outer electrodes to the thorax. The change in TEB is related to the aortic flow pattern and is influenced by the alignment of red blood cells in the aorta. When aortic flow ceases and the aortic valve closes, red blood cells become randomly oriented and interfere with electrical conduction. The ejection of blood forces red blood cells to align in parallel with the flow as the left ventricle contracts and the aortic valve opens, resulting in decreased impedance and higher conductivity.[11] The rate of change in thoracic electrical impedance is used in calculating hemodynamic measures such as stroke volume (SV), CO, pre-ejection period, LV ejection time, and STR by mathematical algorithms.[12-15]
Studies have shown that STR can distinguish intact (>50%) from impaired ejection fraction (EF) (≤50%).[16] Using contrast ventriculography to measure EF, Garrard et al. demonstrated a very high correlation between STR and EF (R = 0.90) in 68 patients with various cardiac diseases.[17] In a study of 453 consecutive patients without valvular heart disease, Boudoulas et al. found agreement between normal EF and normal STR (defined as 0.42) in 85% of cases.[18] Studies have also demonstrated the ease of obtaining an accurate LV systolic performance evaluation using STR measurement by Doppler ECHO. STR correlated well with LV systolic performance indices such as LVEF, dP/dt max (maximum rate of LV pressure during isovolumetric contraction), SV, LV output, and global longitudinal strain (GLS). This method was mainly found helpful in the case of poor-quality windows and for detecting LVEF <35%.[19]
There is no study in the literature regarding the comparison between STR measured from EC and ECHO perioperatively to the best of our knowledge. Therefore, we planned to conduct a comparative study in patients undergoing elective cardiac surgery to study the correlation between STR measured with the EC device ICON (Osypka Medical, Berlin, Germany) and ECHO. The objective is to find a reliable noninvasive technique for estimating LV systolic function during the perioperative period.
Aims and objectives
The aims of this study were to evaluate the correlation between the STR measured from the ICON monitor versus ECHO.
MATERIAL AND METHODS
After obtaining Institutional Ethics Committee approval and written informed consent, we included 120 patients of either gender, belonging to the American Society of Anesthesiologists (ASA) grade II–III, age >5 years, undergoing elective cardiac surgery using cardiopulmonary bypass (CPB).
Inclusion criteria
Patients of either gender, belonging to ASA grade II–III, age >5 years, undergoing elective cardiac surgery using CPB.
Exclusion criteria
Patients with pre-operative arrhythmias, valvular aortic disease, a history of right or LV failure, isolated mitral stenosis, undergoing redo cardiac surgery, pre-operative mechanical ventilation, and pre-operative mechanical circulatory support were excluded from the study.
Anesthesia technique
A routine pre-anesthetic examination was performed 1 day before surgery. The procedure was explained to the parents/patients, and they provided written informed consent. Anesthetic, surgical, and CPB management was standardized in all patients. Premedication in the form of Inj morphine 0.1 mg/kg and Inj promethazine 0.5 mg/kg was administered intramuscularly 30 min before shifting the patient to the operating room. After applying pulse oximetry and five lead electrocardiogram, venous access and radial artery cannulation were established after Inj lignocaine infiltration. Induction of anesthesia was performed with etomidate 0.3 mg/kg, fentanyl 3 µg/kg, and rocuronium bromide 1 mg/kg, followed by tracheal intubation. Controlled ventilation done with 50% oxygen in the air, with a tidal volume of 7–8 mL/kg, and positive end-expiratory pressure of 0–5 mm Hg. Anesthesia was maintained by the intermittent dose of vecuronium, fentanyl, and midazolam.
Method of STR monitoring
The ICON (Osypka Medical, Berlin, Germany) electrical cardiometry device was connected, and the patient’s demographic and anthropometric data (age, weight, and height) were entered. Four skin electrodes were applied on the neck and thorax per manufacturer recommendations [Figure 1] to calculate STR automatically in the designated time points (before anesthesia induction [T0 baseline], after induction [T1], at the end of the surgery [T2], and after extubation [T3])
Patients underwent transthoracic echocardiographic evaluation using transthoracic probe S5-1 connected to an ECHO machine (IE 33, Philips; Bothell, USA). Based on pulsed Doppler aortic acquisitions, STR was obtained as the ratio of the aortic pre-ejection period (PEP: delay from Q wave of QRS to aortic valve opening, ms) to LV ejection time (LVET, ms). All the recordings were taken at the same time points as that of ICON monitor recording.

- Placement sites for electrodes (specific to each letter) as per recommendations from manufacturer.
Statistics
The demographic data are presented in mean±standard deviation or number % whichever is applicable.
Bland–Altman plots were used to study the agreement between the STR measured by EC and transthoracic ECHO. Paired t-tests were used to compare STR measurements at baseline (T0), after induction (T1), at the end of the surgery (T2), and after extubation (T3).
RESULTS
One hundred and twenty patients were recruited for the study (67 males and 53 females) undergoing elective cardiac surgery. The mean age was 48 ± 17 years. Demographic details of the patients and the procedures performed are given in [Tables 1 and 2].
| S. No. | Parameters | Mean value |
|---|---|---|
| 1. | Age (years) | 48±17 |
| 2. | Gender | 67 male, 53 female |
| 3. | Height (cm) | 162±22 cm |
| 4. | Weight (kg) | 59±19 kg |
| 5. | BSA (m2) | 1.57±0.42 m2 |
| 6. | ASA class I II |
89 (74.16%) 31 (25.83%) |
| 7. | Comorbidities Diabetes Hypertension Hypothyroidism Rheumatoid arthritis |
58 (48.33%) 65 (54.16%) 15 (12.5%) 2 (1.66%) |
BSA: Body surface area, ASA: American Society of Anesthesiologists
| S. No. | Surgery | No. of patients |
|---|---|---|
| 1. | CABG | 81 (67.5%) |
| 2. | ASD closure | 24 (20%) |
| 3. | TOF repair | 12 (10%) |
| 4. | DCRV repair | 03 (2.5%) |
ASD: Atrial septal defect, DCRV: Double committed right ventricle, CABG: Coronary artery bypass grafting, TOF: Tetralogy of fallot
STR value obtained using EC at T0, T1, T2, and T3 were significantly different from those obtained from ECHO, P < 0.001 [Table 3].
| T0 | T1 | T2 | T3 | |
|---|---|---|---|---|
| STR by EC | 0.456 (0.429–0.483) | 0.464 (0.442–0.486) | 0.421 (0.402–0.439 | 0.438 (0.419–0.457) |
| STR by ECHO | 0.348 (0.330–0.366) | 0.372 (0.344–0.401) | 0.305 (0.290–0.320) | 0.353 (0.336–0.370) |
| P-value | <0.001 | <0.001 | <0.001 | <0.001 |
STR: Systolic time ratio, EC: Electrical cardiometry, ECHO: Echocardiography
Bland–Altman analysis showed that EC measured STR compared with ECHO at T0 [Figure 2], with a mean bias of 0.108 and (with limits of agreement −0.19, 0.41) at T1 [Figure 3] is 0.092 (with limits of agreement −0.22, 0.40), at T2 [Figure 4] is 0.11 (with limits of agreement between −0.05 and 0.28), and at T3 [Figure 5] is 0.085 (with limits of agreement between −0.101 and 0.271).
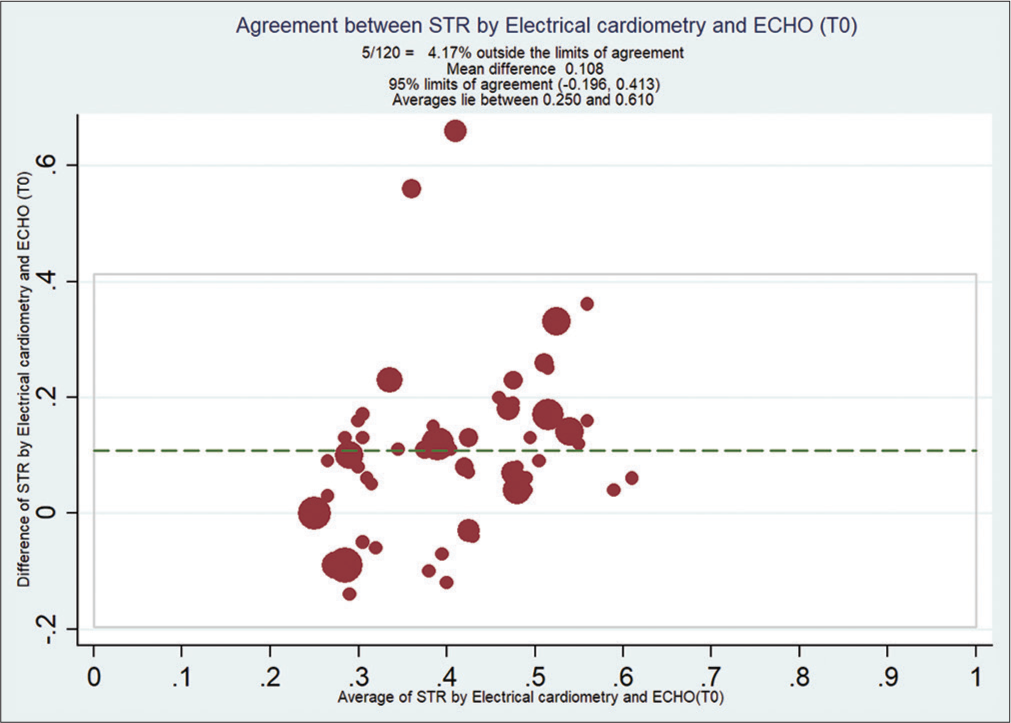
- Bland–Altman analysis of systolic time ratio (STR) by electrical cardiometry (EC) and echocardiography (ECHO) at T0. X-axis: Average of STR from EC and ECHO, Y-Axis: Difference of STR by EC and ECHO. Mean bias of 0.108 and (with limits of agreement −0.19, 0.14).
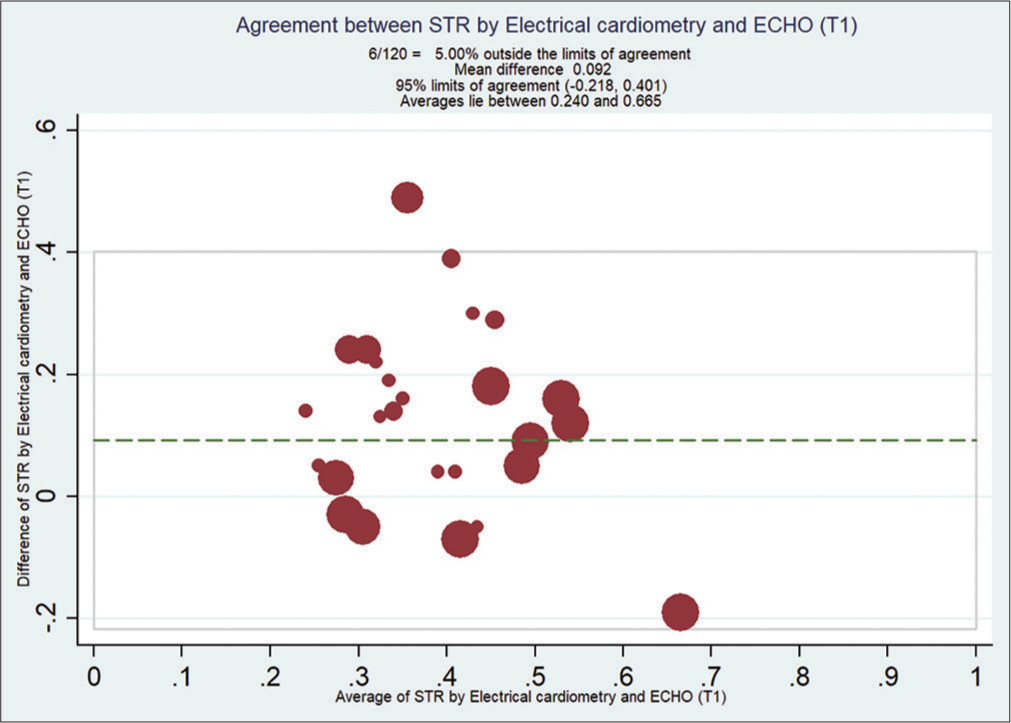
- Bland–Altman analysis of systolic time ratio (STR) by electrical cardiometry (EC) and echocardiography (ECHO) at T1. X-axis: Average of STR from EC and ECHO, Y-Axis: Difference of STR by EC and ECHO. Mean bias is 0.092 (with limits of agreement between −0.218 and 0.401).
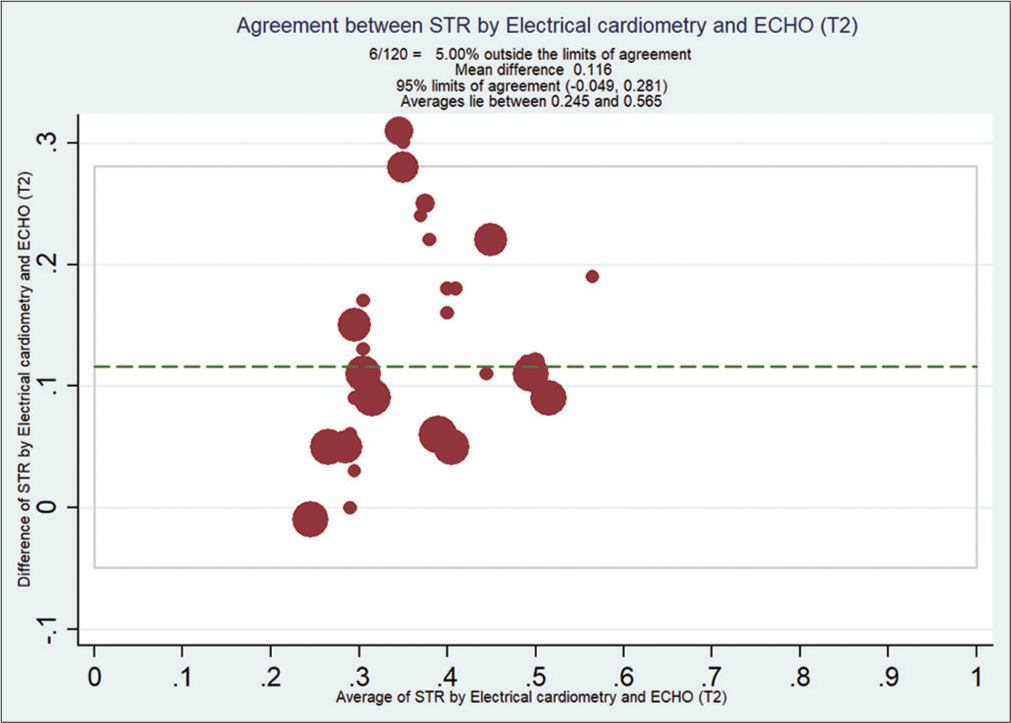
- Bland–Altman analysis of systolic time ratio (STR) by electrical cardiometry (EC) and echocardiography (ECHO) at T2. X-axis: Average STR from EC and ECHO, Y-Axis: Difference of STR by EC and ECHO. Mean bias of 0.11 (with limits of agreement between −0.04 and 0.28).
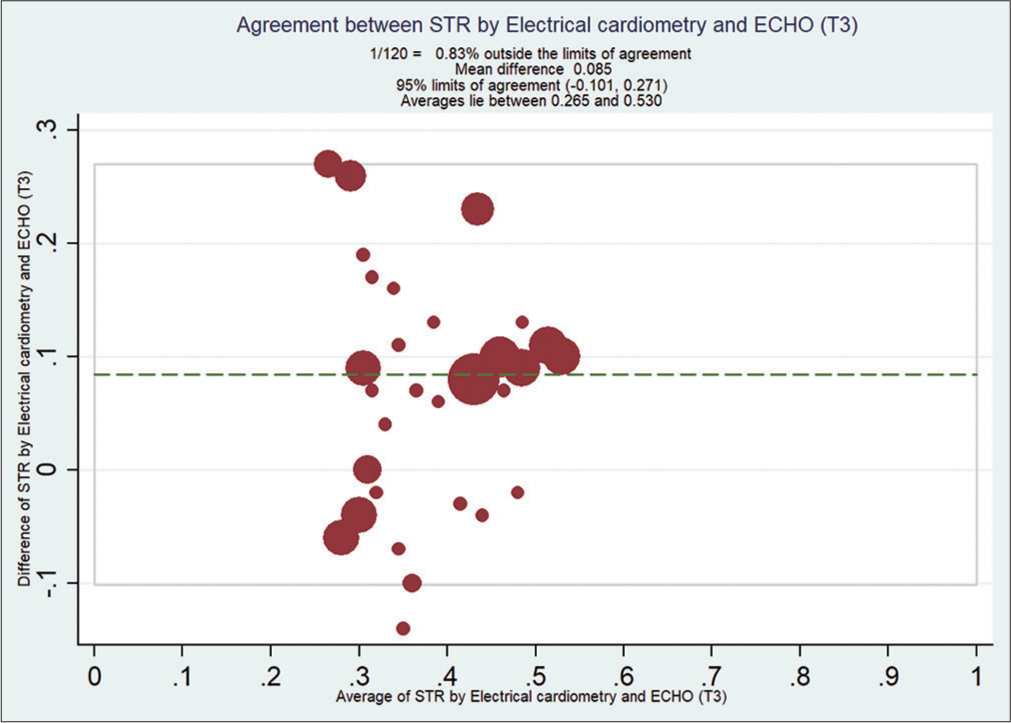
- Bland–Altman analysis of systolic time ratio (STR) by electrical cardiometry EC and echocardiography (ECHO) at T3. X-axis: Average STR from EC and ECHO, Y-Axis: Difference of STR by EC and ECHO. Mean bias of 0.085 (with limits of agreement between −0.101 and 0.27).
DISCUSSION
This prospective, randomized, and observational study was conducted to evaluate the correlation between the STR measured from an EC monitor versus ECHO.
LVEF is a main indicator for the evaluation of LV systolic function and can be easily obtained by ECHO. However, this equipment is costly in clinical practice and requires trained personnel, which also limits its application. Several generations of TEB devices using bioimpedance algorithms based on cylinder or cone models of the human thorax have been commercially developed. Various problems with earlier models now have been overcome with the up-gradation of computer technology and refinement of algorithms to calculate CO. The technique now is referred to as “electrical cardiometry.” EC is a relatively affordable and simple technique that can monitor hemodynamics noninvasively in real time.
Reant et al.[9] studied 134 consecutive heart failure (HF) patients and 43 control subjects to compare STR echocardiographic measurements with LV function parameters, including myocardial strain by speckle tracking. In patients with increasingly altered LVEF or GLS, PEP significantly increased, whereas LVET decreased, resulting in a significantly increased PEP/LVET ratio. Thompson et al.[16] conducted a retrospective study on 52 patients to assess the relationship between EF by ECHO or gated nuclear ventriculography and STR by impedance cardiography (ICG) in outpatients with chronic HF. There was an inverse correlation between STR and EF (P < 0.001). An EF ≤ 50% and STR ≥ 0.50 demonstrated 93% sensitivity and 85% specificity. STR was able to distinguish intact (>50%) from impaired EF (≤50%). Hemodynamic parameters measured by EC compared with the other gold standard techniques have mixed results.
Malik V,[20] Rajput R[21] and Narula J et al.[10] found a good correlation between the hemodynamic parameters measured by electrical cardiometry and pulmonary artery catheter. Our results agree with the work done by Cox PBW et al.[22] Elgebaly AS et al. found a strong positive correlation between echocardiography and non invasive cardiometry while measuring cardiac output and stroke volume in patients undergoing lung surgery.[23] A prospective observational study evaluated the accuracy, precision, and trending ability of cardiac index (CI) measurements using the Aesculon™ bioimpedance electrical cardiometry to the continuous PAC technique before, during, and after cardiac surgery. CI obtained by continuous PAC and Aesculon bioimpedance were not interchangeable in patients undergoing cardiac surgery. The percentage error between the two techniques was above 30% every time.[24]
Feng SM et al.[25] conducted a prospective observational study to assess the accuracy and interchangeability of stroke volume and cardiac output measurements during caesarean delivery using electrical velocimetry and transthoracic echocardiography during cesarean delivery in 20 parturient patients and found that electrical velocimetry monitoring has limited accuracy, precision, and interchangeability with transthoracic echocardiography.
The present study showed a clinically unacceptable difference between STR values measured by ICON monitor using the principle of electrical cardiometry and by pulse doppler echocardiography before induction (T0 baseline), after induction (T1), and at the end of the surgery (T2) and after extubation (T3). Whether the device over or underestimated the actual value of STR remains speculative.
Surgery in the area of the diaphragm or affecting the chest can decrease the accuracy of thoracic electrical bioimpedance, as the technique shows a poor correlation after cardiac surgery or major abdominal surgery.[22] Critchley LA and Peng ZY et al. demonstrated (in dogs and humans) that vasodilation/ vasoconstriction status, lung fluid balance, and acute lung injury can all reduce ICG accuracy when compared to the thermodilution technique.[26-27] The application of positive airway pressure can also be a confounding factor that changes the thoracic volume and influences impedance measurements.[28]
The error may be attributed to flaws in the EC device’s algorithm or in performing pulse Doppler ECHO. Considering these unfavorable reports and our findings, the value of STR by EC for evaluating LVEF remains controversial.
Limitations of the study
Patients with normal cardiac anatomy were not included in our study. Another potential source of disagreement might be that measurements were performed irrespective of the respiratory phases because they may induce STR variations over the respiratory cycle. The cohorts enrolled in the study were heterogeneous, and the study was not powered sufficiently to assess STR based on the presence of intracardiac/extracardiac shunts and left/right ventricular outflow tract obstruction or the effect of general anesthesia.
CONCLUSION
No association between STR as measured by EC and ECHO was found in our study. We cannot categorically attribute all the errors to EC, and we acknowledge that ECHO may have some inherent errors. However, given the poor agreement between STR measured by EC and pulse Doppler ECHO, this clinically accepted tool, we cannot endorse the use of STR for evaluating LVEF and thus LV systolic function. Our results do not conclusively prohibit using EC in the perioperative period to evaluate LV systolic function. Further work must be done to establish the role of STR as a surrogate marker of LV systolic function.
Declaration of patient consent
The authors certify that they have obtained all appropriate patient consent.
Conflicts of interest
Dr. Minati Choudhury is one of the members of Associate Editors, Dr. Sandeep Chauhan is one of the members of Editorial Board and Dr. Poonam Malhotra Kapoor is Editor-In-Chief of the Journal.
Financial support and sponsorship
Nil.
References
- Influence of ejection fraction on cardiovascular function in a broad spectrum of heart failure patients. Circulation. 2005;112:3738-44.
- [CrossRef] [PubMed] [Google Scholar]
- The pulmonary artery catheter, 1967-2007: Rest in peace? JAMA. 2007;298:458-61.
- [CrossRef] [PubMed] [Google Scholar]
- Strain and strain rate imaging by echocardiography-basic concepts and clinical applicability. Curr Cardiol Rev. 2009;5:133-48.
- [CrossRef] [PubMed] [Google Scholar]
- Systolic time intervals as measures of the contractile state of the left ventricular myocardium in man. Circulation. 1972;46:559-71.
- [CrossRef] [PubMed] [Google Scholar]
- Evaluation of the pre-ejection period as an estimate of myocardial contractility in dogs. Am J Cardiol. 1971;27:384-91.
- [CrossRef] [PubMed] [Google Scholar]
- Systolic time intervals in heart failure in man. Circulation. 1968;37:149-59.
- [CrossRef] [PubMed] [Google Scholar]
- A critical review of the systolic time intervals. Circulation. 1977;56:146-58.
- [CrossRef] [PubMed] [Google Scholar]
- Systolic time intervals by echocardiography. Circulation. 1975;51:114-7.
- [CrossRef] [PubMed] [Google Scholar]
- Systolic time intervals as simple echocardiographic parameters of left ventricular systolic performance: Correlation with ejection fraction and longitudinal two-dimensional strain. Eur J Echocardiogr. 2010;11:834-44.
- [CrossRef] [PubMed] [Google Scholar]
- Electrical cardiometry: A reliable solution to cardiac output estimation in children with structural heart disease. J Cardiothorac Vasc Anesth. 2017;31:912-7.
- [CrossRef] [PubMed] [Google Scholar]
- Hemodynamic reference for neonates of different age and weight: A pilot study with electrical cardiometry. J Perinatol. 2016;36:481-5.
- [CrossRef] [PubMed] [Google Scholar]
- Stroke volume equation for impedance cardiography. Med Biol Eng Comput. 2005;43:443-50.
- [CrossRef] [PubMed] [Google Scholar]
- Electrophysiologic principles and theory of stroke volume determination by thoracic electrical bioimpedance. AACN Clin Issues. 1999;10:385-99.
- [CrossRef] [PubMed] [Google Scholar]
- Bench to bedside: Electrophysiologic and clinical principles of noninvasive hemodynamic monitoring using impedance cardiography. Acad Emerg Med. 2003;10:669-80.
- [CrossRef] [PubMed] [Google Scholar]
- Time intervals and global cardiac function. Use and limitations. Eur Heart J. 2004;25:2185-6.
- [CrossRef] [PubMed] [Google Scholar]
- Systolic time ratio by impedance cardiography to distinguish preserved vs impaired left ventricular systolic function in heart failure. Congest Heart Fail. 2008;14:261.
- [CrossRef] [PubMed] [Google Scholar]
- The relationship of alterations in systolic time intervals to ejection fraction in patients with cardiac disease. Circulation. 1970;42:455-62.
- [CrossRef] [PubMed] [Google Scholar]
- Assessment of ventricular function by combined noninvasive measures: Factors accounting for methodologic disparities. Int J Cardiol. 1983;2:493-501.
- [CrossRef] [PubMed] [Google Scholar]
- Comparison of impedance cardiography with invasive hemodynamic measurements in patients with heart failure secondary to ischemic or nonischemic cardiomyopathy. Am J Cardiol. 2002;89:993-5.
- [CrossRef] [PubMed] [Google Scholar]
- Correlation of electric cardiometry and continuous thermodilution cardiac output monitoring systems. World J Cardiovasc Surg. 2014;4:101-8.
- [CrossRef] [Google Scholar]
- Comparison of cardiac output measurement by noninvasive method with electrical cardiometry and invasive method with thermodilution technique in patients undergoing coronary artery bypass grafting. World J Cardiovasc Surg. 2014;4:123-30.
- [CrossRef] [Google Scholar]
- Accuracy, precision, and trending ability of electrical cardiometry cardiac index versus continuous pulmonary artery thermodilution method: A prospective, observational study. Biomed Res Int. 2017;2017:2635151.
- [CrossRef] [PubMed] [Google Scholar]
- The accuracy of electrical cardiometry for the noninvasive determination of cardiac output before and after lung surgeries compared to transthoracic echocardiography. Ann Card Anaesth. 2020;23:288-92.
- [CrossRef] [PubMed] [Google Scholar]
- Non invasive cardiac output measurement with electrical velocimetry in patients undergoing liver transplantation: Comparison of an invasive method with pulmonary thrmodilution. BMC Anesthesiol. 2018;18:138.
- [CrossRef] [PubMed] [Google Scholar]
- Electrical velocimetry has limited accuracy and precision and moderate trending ability compared with transthoracic echocardiography for cardiac output measurement during cesarean delivery. Medicine (Baltimore). 2020;99:e21914.
- [CrossRef] [PubMed] [Google Scholar]