Translate this page into:
Comparing the Liquid Heparin Syringe with Dry Bound Heparin Syringe for Blood Gas Analysis
Manoj Kumar Sahu, MD, DNB Department of Cardiothoracic and Vascular Surgery CTVS Office, 7th Floor, CN Centre All India Institute of Medical Sciences New Delhi 110029 India drmanojsahu@gmail.com
This article was originally published by Thieme Medical and Scientific Publishers Private Ltd. and was migrated to Scientific Scholar after the change of Publisher.
Abstract
Background Blood gas (BG) analysis is routine today for patient management in intensive care units. Accurate analysis of different parameters in the BG is essential for managing critical patients. Errors in BG analysis can happen at many levels, with one of them being at sampling and heparinization. We compared self-prepared heparinized syringes rinsed with liquid heparin (LH) and the standard commercially available syringes with dry bound heparin (DBH) for arterial BG analysis of postoperative cardiac surgical patients.
Methods This prospective observational study was conducted in 100 consecutive adult cardiac surgical patients in the cardiac surgical intensive care unit. Paired samples were collected, analyzed immediately, and statistically compared for pH, partial pressure of arterial oxygen (pO2), partial pressure of arterial carbon dioxide (pCO2), oxyhemoglobin saturation (SaO2), HCO, Na+, K+, Cl–, Ca2+, Mg2+, base excess (BE), hemoglobin (Hb), hematocrit, glucose, and lactate. Paired parameters were compared and agreement was evaluated using Bland–Altman difference plots. The 95% limits of absolute agreement (LOA) were compared with total allowable error (TEa).
Results The BG parameters analyzed by two types of heparinized (LH and DBH) syringes were found to be comparable with a negligible mean difference and had an agreement outside the TEa of 8% for pO2, pCO2, and hematocrit, 7% for BE, 6% for Mg2+, 5% for K+, Ca2+, and lactate, 4% for HCOand Na+, 3% for pH, Cl–, Hb, and glucose, and zero for SaO2. The two types of syringes did not show clinically relevant discrepancies among many different parameters as per LOA and TEa limits.
Conclusion In this study, we found that the BG parameters—respiratory, metabolic, and electrolytes—were comparable between the two types of syringes used for sampling. Unlike some previous studies, we did not find statistically significant differences among these analytes, which might have been due to appropriate self-preparation of heparin syringes.
Keywords
blood gas analysis
dry bound heparin syringe
liquid heparin syringe

Introduction
Blood gas (BG) analysis is an essential part of the diagnosis and management of alteration in respiratory and metabolic parameters of the body. It has been an important tool for emergency physicians, anesthesiologists, and intensivists to understand and manage the critically ill patients. Faster and accurate results are important to form rule-out and rule-in strategies in these sick patients. The usefulness of this diagnostic tool is dependent on the accuracy of sampling, volume of syringe used, amount of sample, type and amount of heparin used, storage, transport, and timing of analysis to correctly interpret the results. However, many preanalytical errors are possible while collecting blood samples, leading to erroneous BG values.1 This may have an influence on the further management of extremely vulnerable patients.
Although the guidelines by the National Committee for Clinical & Laboratory Standards Institute (CLSI), Wayne, Pennsylvania, United States, suggested the use of commercially prepared dry bound heparin (DBH) syringes (which avoids dilution due to the use of dried heparin), still self-prepared liquid heparin (LH) syringes are used in many emergency and intensive care units (ICUs) for BG analysis to curtail heavy economic burden in high-volume hospitals with lack of resource.2, 3 LH may have many effects on BG analysis due to its dilutional effect on plasma, thereby altering some parameters such as partial pressure of arterial carbon dioxide (pCO2) and electrolytes. By binding to positive ions such as Ca2+, Na+, and K , LH may result in falsely low values.4 In addition, the heparin sodium or heparin calcium salts may have composition effects on BG analysis, leading to positive bias.4 There are no universally accepted guidelines or recommendations for the manually prepared heparinized syringes for sampling, and this remains a nonstandardized method among many ICUs.5 Hence, our study aimed to compare LH and DBH syringes in arterial BG analysis of postoperative adult cardiac surgical patients in our ICU.
Material and Methods
This prospective observational study was conducted in a cohort of adult patients older than 18 years admitted to the cardiac surgical ICU of a high-volume tertiary care teaching hospital. The study was conducted during a 3-month period from April 2019 to June 2019 after obtaining ethics approval from the institute. Paired samples were collected from 100 consecutive adults who underwent open-heart surgeries electively and admitted to the ICU for postoperative management. Informed consent was invariably obtained from all the patients for ICU management, including blood sampling for different laboratory tests including arterial BG analysis. One paired sample was taken from each patient at a point of time on the second postoperative day, when the patients have become fully clinically, hemodynamically, and metabolically (from the last BG analysis) stable, and ready to be discharged from ICU. Samples were taken from the existing invasive arterial lines (after discarding double the standard dead space volume) placed during surgery, and patients were not punctured separately for drawing arterial blood. BG analysis was performed at the same time soon after drawing and mixing the blood with heparin in the sampling syringes (within 60 seconds), without any waiting period or transport, as BG machines are installed in our ICU.
Study Syringes Details
-
Type 1 syringe was a conventional 2-mL syringe (Solo-Med plastic hypodermic syringes, Becton Dickinson India Pvt. Ltd., Haryana, India) with a needle (24-G, 1-inch) containing the smallest measurable division of 0.01 mL. Type 1 syringes were self-prepared by first filling the barrel of the syringe until 0.5-mL (2,500 units of heparin) marking and then flushing out all the LH solution and air four times so that no visible LH solution was left in the syringe barrel or hub. LH solution (Hepaglan-25) derived from gut mucosa, containing 5,000 IU/ml strength of heparin (Gland Pharma Limited, Telangana, India), was used for the preparation of Type 1 syringe. The analysis of LH solution by the same BG analyzer revealed pH of 7.40, pCO2 of 3.8 mm Hg, pO2 of 111.9 mm Hg, glucose of 0 mg/dL, SO2 of 98.7%, base excess (BE)-b of–17.2 mmol/L, HCO3 of 2.4 mmol/L, and lactate, Na, K, Cl, Ca, Mg–of 0 mmol/L as LH in syringe get in equilibrium with the air.
-
Type 2 syringes are commercially prepared electrolyte DBH 3-mL syringes without a needle (Smith Medical ASD Inc., Keene, New Hampshire, United States) containing the smallest measurable division of 0.01 mL. These syringes contain approximately 23.57 IU units of heparin per milliliter capacity, and the coated material is dry lithium heparin.
Type 1 syringes were prepared just before the sample collection. All the paired arterial samples were collected in type 1 and type 2 syringes till 1-mL mark in the syringe. The samplings were performed at bedside by the same trained senior resident in all the study patients. Meticulous precautions were taken to mix the blood with heparin well while preventing hemolysis and formation of air bubbles by gently rolling the blood-filled syringe between the palms and finally pushing the piston slowly upward when the nozzle is open to atmosphere in an upward direction and caped as soon as the blood reaches the tip. Paired samples were analyzed immediately after collection by one BG analyzer with star profile and cartridge system (pHOx Ultra, NOVA Biomedical, Waltham, Massachusetts, United States) installed in the ICU. This BG analyzer calibrated automatically every 4 hourly and was checked weekly with control solutions.
Statistical Analysis
All BG parameters were expressed as mean and standard deviation (SD). The Wilcoxon matched-pair signed-rank test was used to compare paired variables. It compared the bias (mean difference) and precision (SD of bias) of type 1 (LH) syringe versus type 2 (DBH) syringe sampling for BG analysis. Bland-Altman difference plots were used to assess and calculate 95% limits of agreement (LOA). LOA of BG analytes were then compared with the total allowable error (TEa). TEa is the total amount error in a test that is medically, administratively, and legally acceptable. The proportion of sample beyond TEa % was then calculated, and TEa < 10% is considered as statistically insignificant.
Results
A total of 100 consecutive postoperative cardiac surgical patients were included in our study, and the population comprised middle-aged adults with a mean age of 40.13 ± 21.91 (mean ± SD) and mixture of both genders (male:female = 68:32). A total of 200 samples were collected from these patients (100 samples each in two different types of heparinized syringes) and analyzed. The pairwise comparison between samples collected in type 1 (LH) and type 2 (DBH) syringes, such as mean with SD, mean difference, 95% LOA, proportion beyond TEa %, are shown in Table 1.
|
Parameters |
LH, mean (SD) |
DBH, mean (SD) |
Mean bias |
95% LOA |
Proportion, beyond TEa % |
|---|---|---|---|---|---|
|
Abbreviations: Ca, calcium; BE, base excess; DBH, dry bound heparin; Hb, hemoglobin; HCO3, bicarbonate; Hct, hematocrit; K, potassium; LH, liquid heparin; Mg, magnesium; Na, sodium; SD, standard deviation. Descriptive statistics, mean with SD, mean bias, 95% limits of agreement (LOA), proportion of sample beyond TEa %. |
|||||
|
pH |
7.41 (0.064) |
7.41 (0.06) |
–0.003 |
–0.033 to 0.028 |
3 |
|
pCO2 (mm Hg) |
32.59 (5.50) |
32.879 (5.50) |
–3.084 |
–24.217 to 18.049 |
8 |
|
pO2 (mm Hg) |
157.46 (68.34) |
160.54 (68.34) |
–0.272 |
–4.555 to 4.011 |
8 |
|
SaO2% |
98.46 (2.53) |
98.66 (2.43) |
0 |
0.000 to 0.000 |
0 |
|
HCO3–(mmol/L) |
20.72 (3.39) |
21.20 (3.39) |
–0.196 |
–1.609 to 1.217 |
4 |
|
Na+ (mmol/L) |
138.57 (5.31) |
139.08 (5.31) |
–0.511 |
–4.366 to 3.344 |
4 |
|
K+ (mmol/L) |
3.85 (0.57) |
3.95 (0.57) |
–0.098 |
–0.565 to 0.368 |
5 |
|
Cl–(mmol/L) |
107.39 (5.40) |
109.07 (5.55) |
–1.676 |
–6.531 to 3.179 |
3 |
|
Ca2+ mmol/L) |
1.08 (0.12) |
1.22 (0.10) |
–0.137 |
–0.362 to 0.088 |
5 |
|
Mg2+ (mmol/L) |
0.58 (0.19) |
0.67 (0.19) |
–0.086 |
–0.252 to 0.081 |
6 |
|
BE (mmol/L) |
–2.62 (3.55) |
–2.27 (3.61) |
–0.350 |
–2.410 to 1.710 |
7 |
|
Hb (gm/dL) |
11.99 (1.83) |
11.98 (1.91) |
0.009 |
–1.783 to 1.801 |
3 |
|
Hct |
36.48 (5.39) |
36.26 (5.60) |
0.220 |
–4.337 to 4.777 |
8 |
|
Glucose (mg/dL) |
150.90 (54.18) |
157.55 (59.31) |
–6.650 |
–42.655 to 29.355 |
3 |
|
Lactate (mmol/L) |
1.98 (1.60) |
2.12 (1.72) |
–0.148 |
–0.718 to 0.422 |
5 |
Results of the present study showed that samplings in type 1 (LH) and type 2 (DBH) syringes were comparable with a negligible mean difference. The LOA and sample outside the TEa was 8% for pO2, pCO2, and hematocrit (Hct), 7% for BE, 6% for magnesium (Mg2+), 5% for potassium (K+), calcium (Ca2+), and lactate, 4% for bicarbonate (HCO) and sodium (Na+), 3% for pH, chloride (Cl–), hemoglobin (Hb), and glucose, and 0% for oxyhemoglobin saturation (SaO2). Figures from 1 to 8 shows the Bland–Altman plots for different BG analytes such as pH (Fig. 1), pCO2 (Fig. 2), calcium (Fig. 3), magnesium (Fig. 4), BE (Fig. 5), lactate (Fig. 6), Hct (Fig. 7), and glucose (Fig. 8) individually.
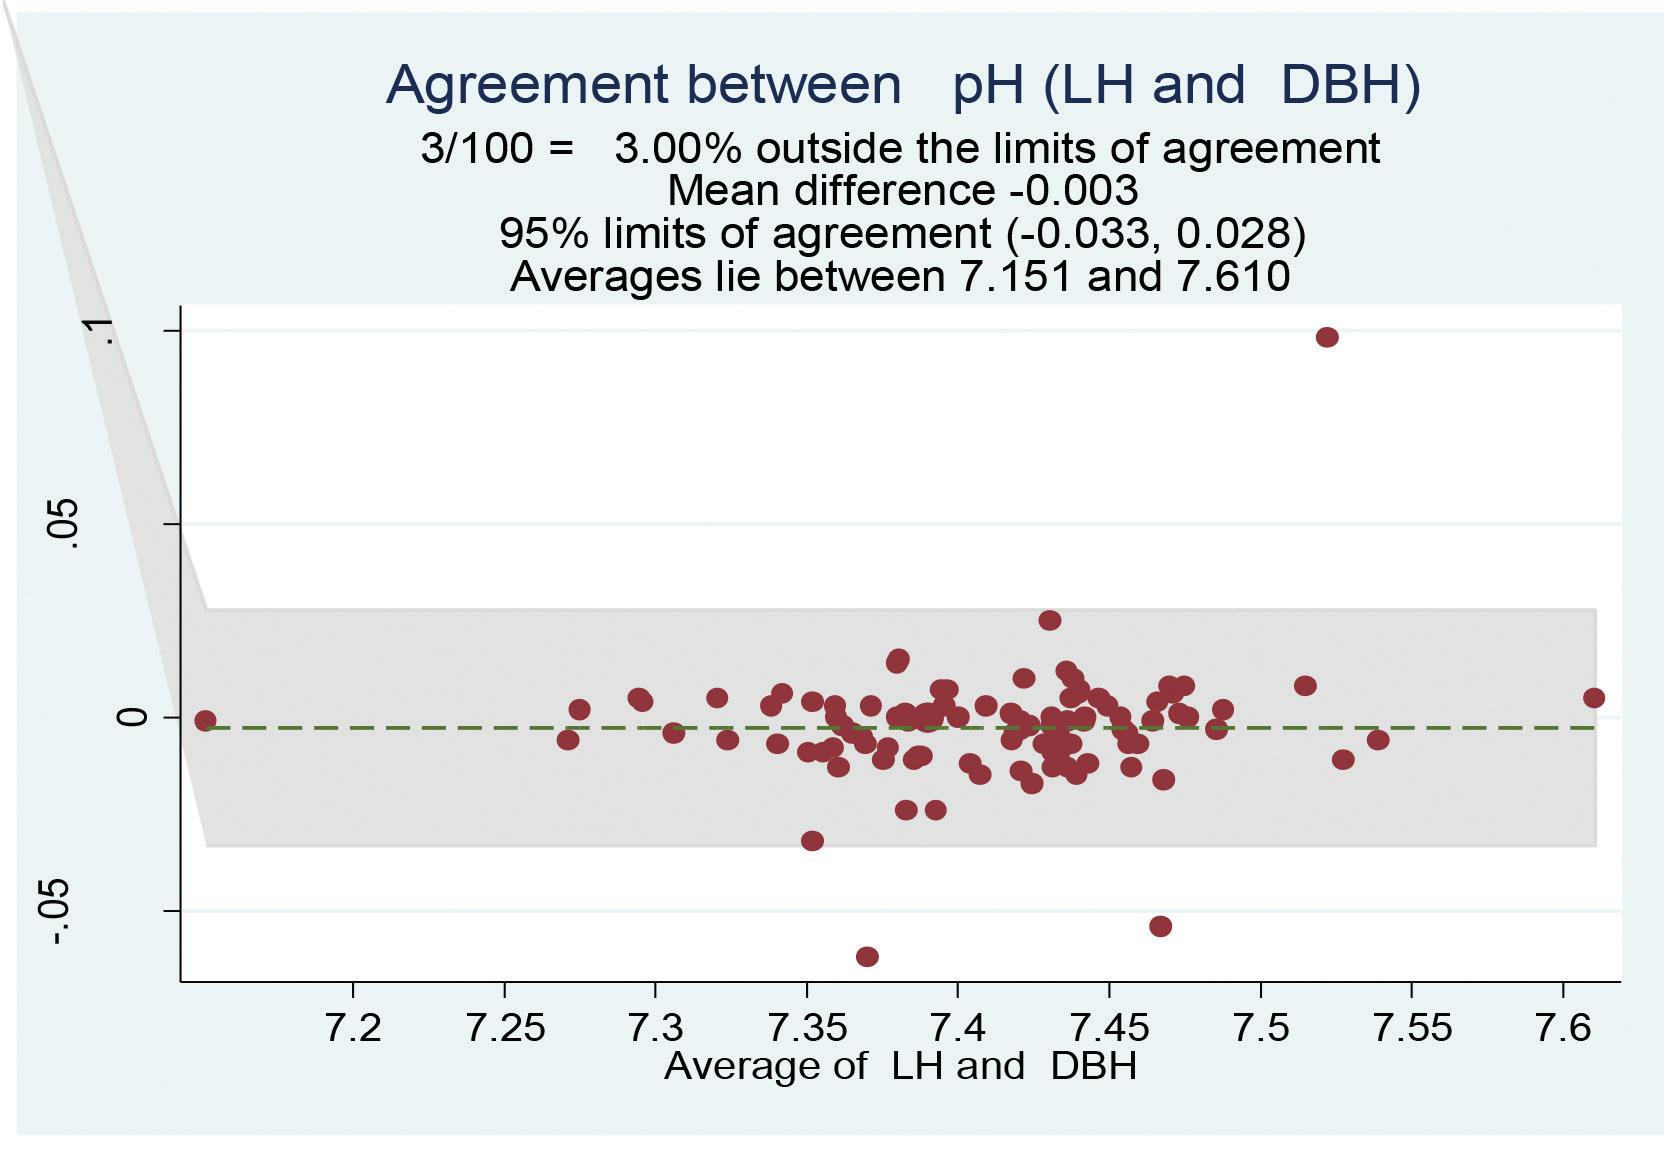
- Bland–Altman plot of pH for the LH group was comparable with that of the DBH group. DBH, dry bound heparin; LH, liquid heparin.
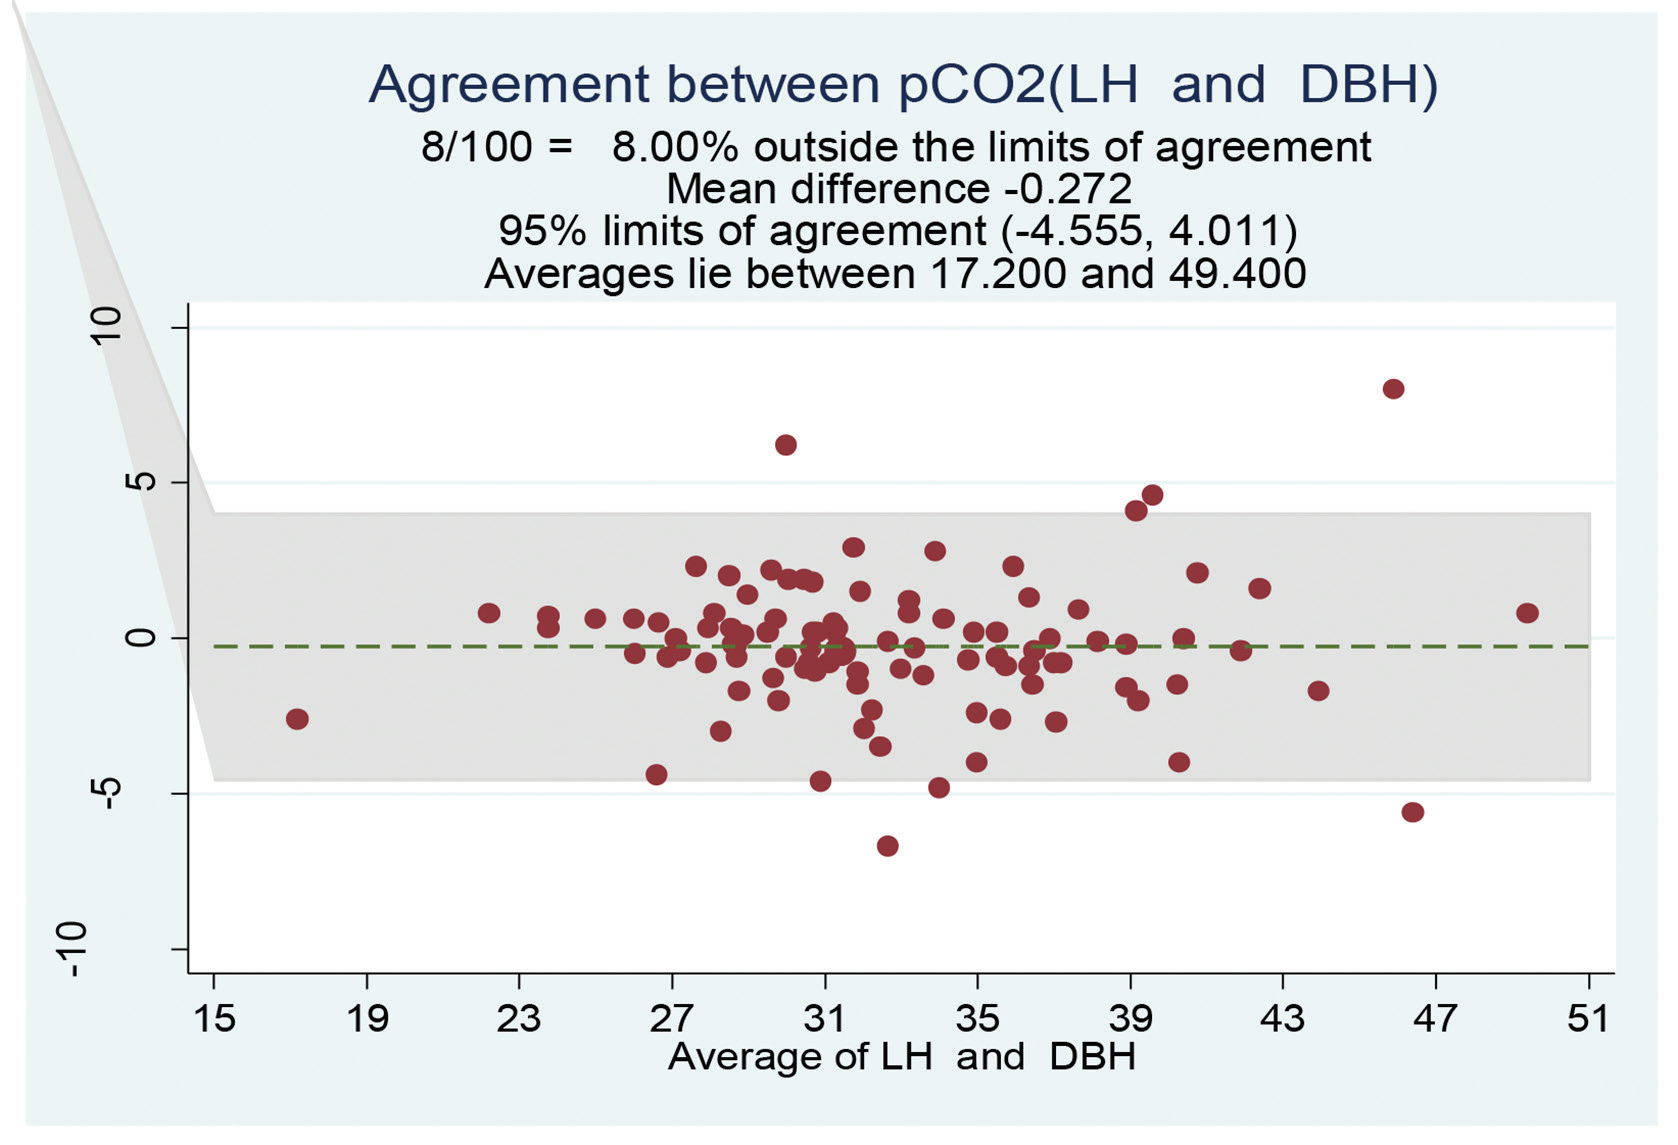
- Bland–Altman plot of partial pressure of carbon dioxide (mm Hg) for the liquid heparin group was comparable with that of the DBH group. DBH, dry bound heparin; LH, liquid heparin. DBH, dry bound heparin; LH, liquid heparin.
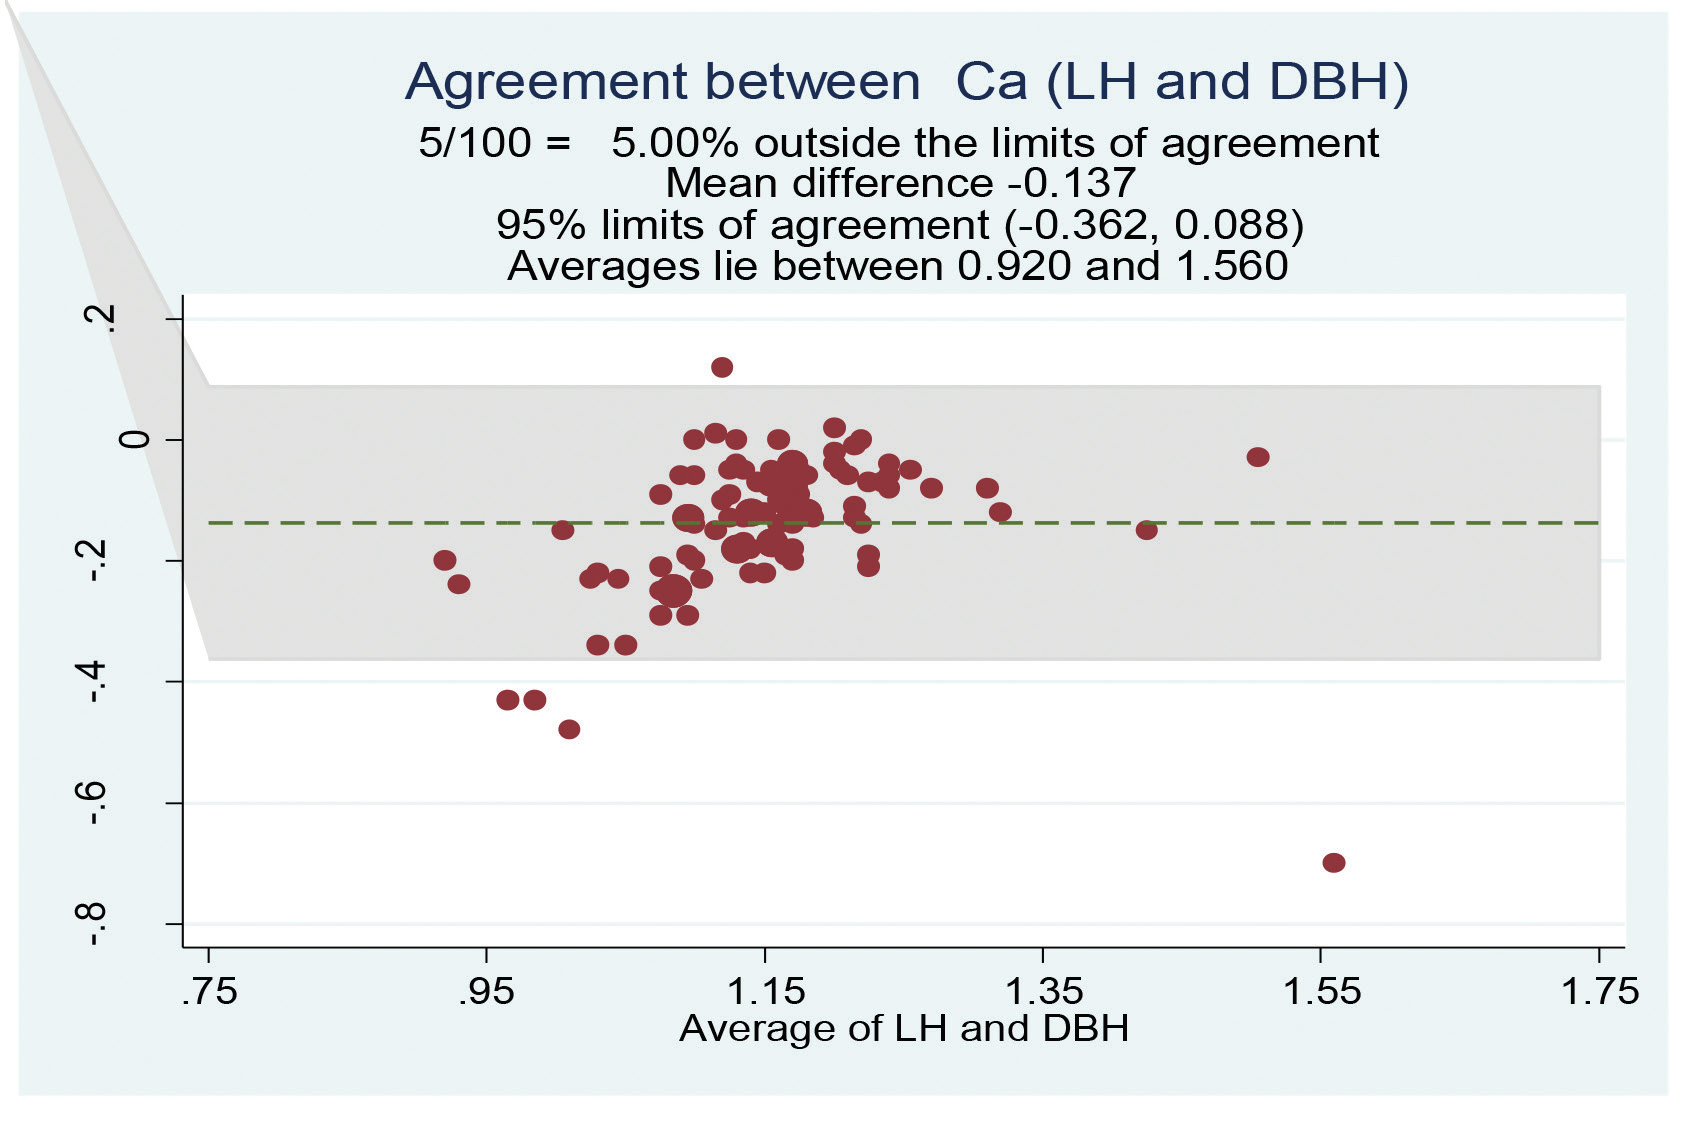
- Bland–Altman plot of calcium (mmol/L) for the LH group compared with that of the DBH group. DBH, dry bound heparin; LH, liquid heparin.
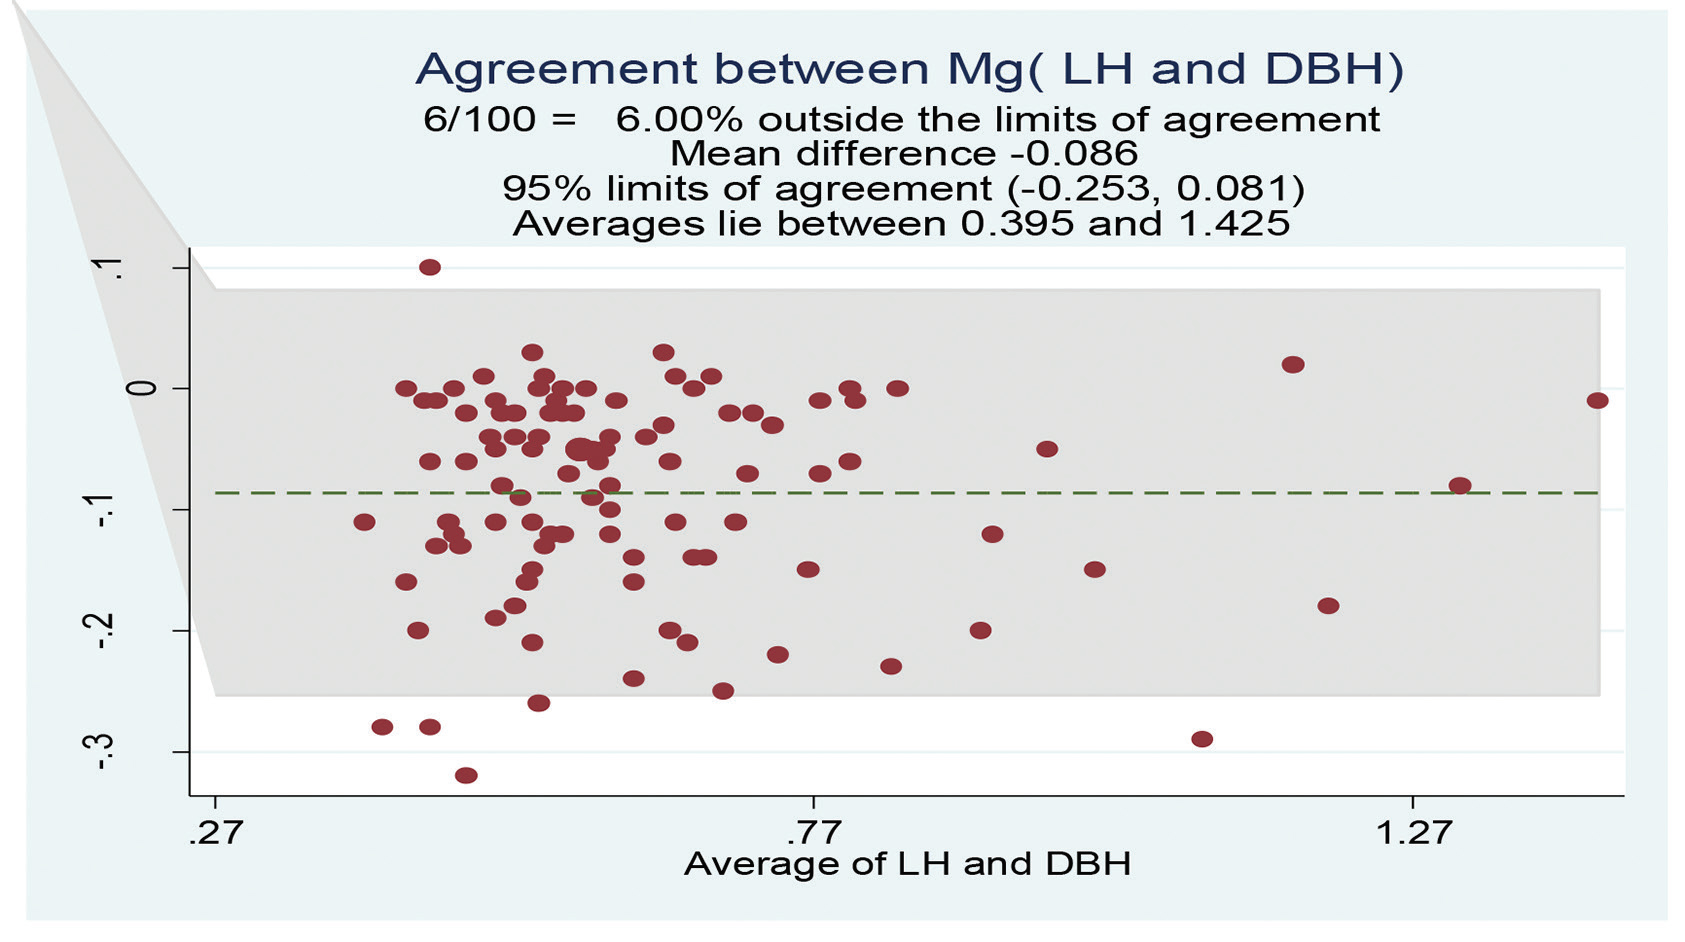
- Bland–Altman plot of magnesium (mmol/L) for the LH group was comparable with that of the DBH group. DBH, dry bound heparin; LH, liquid heparin.
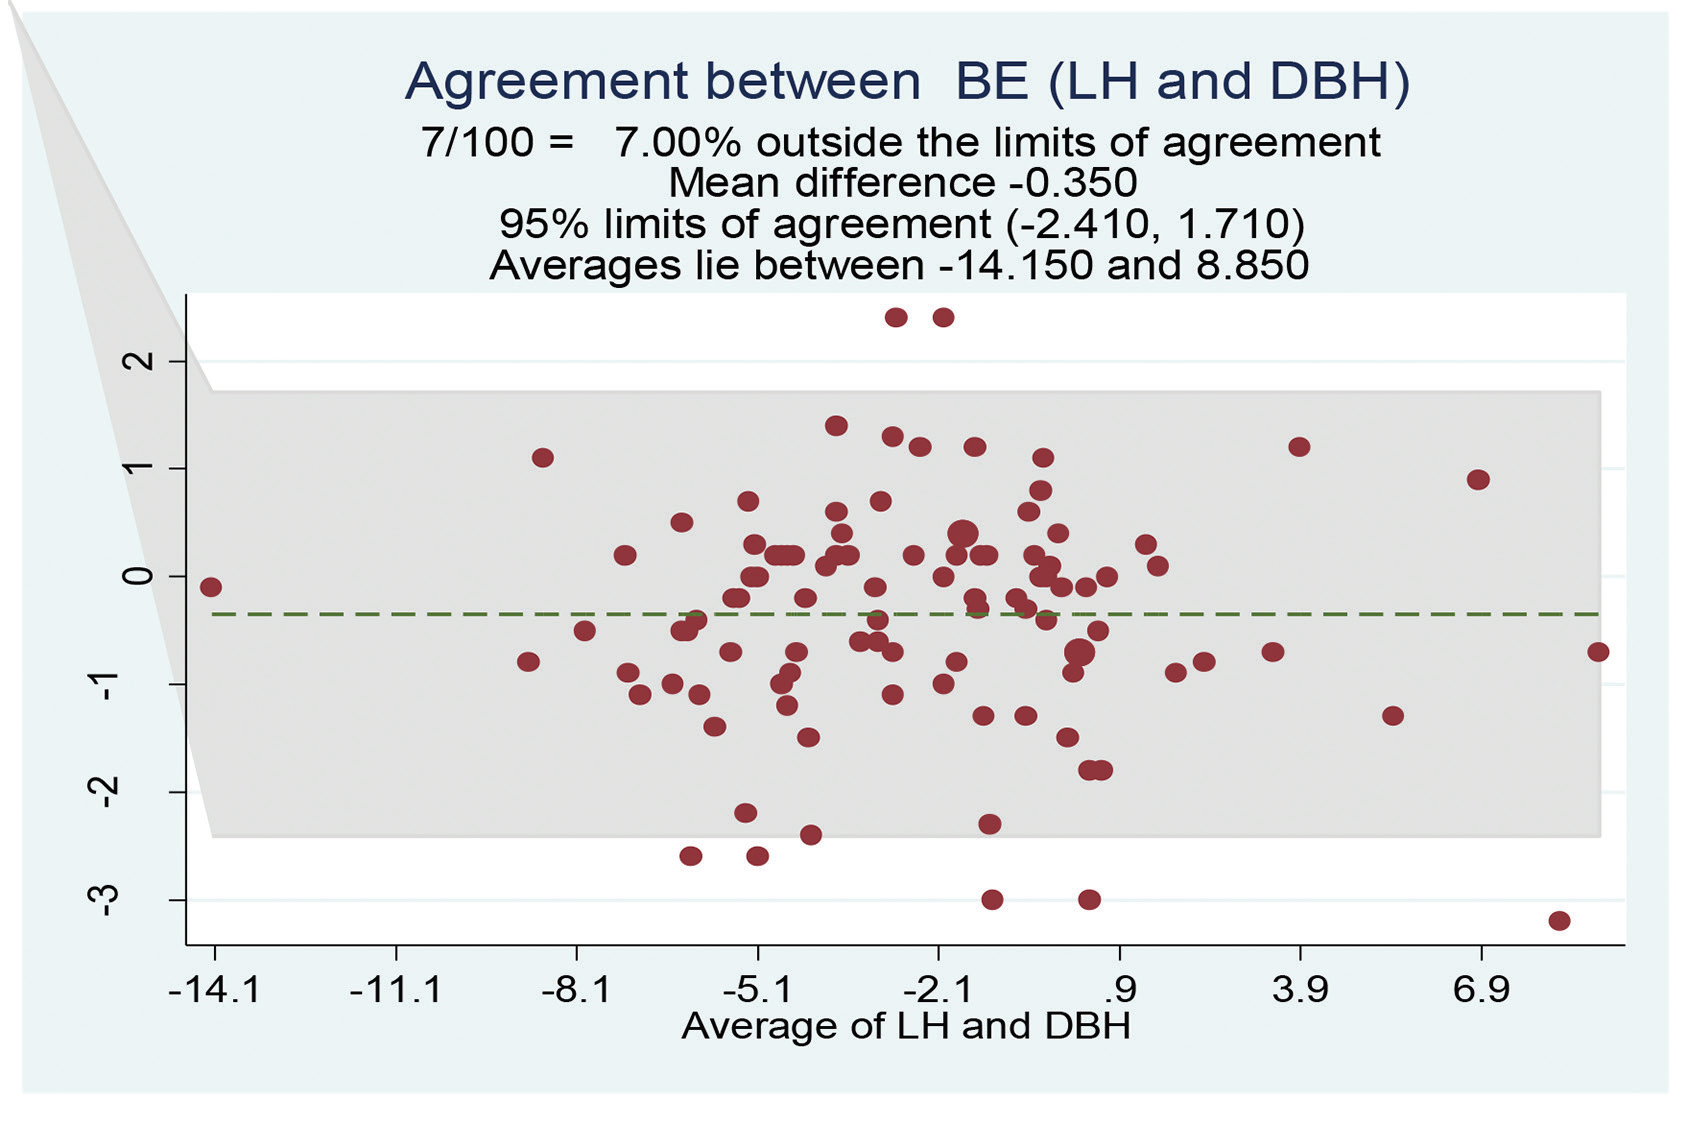
- Bland–Altman plot of BE (mmol/L) for the LH group was comparable with that of the DBH group. DBH, dry bound heparin; LH, liquid heparin.
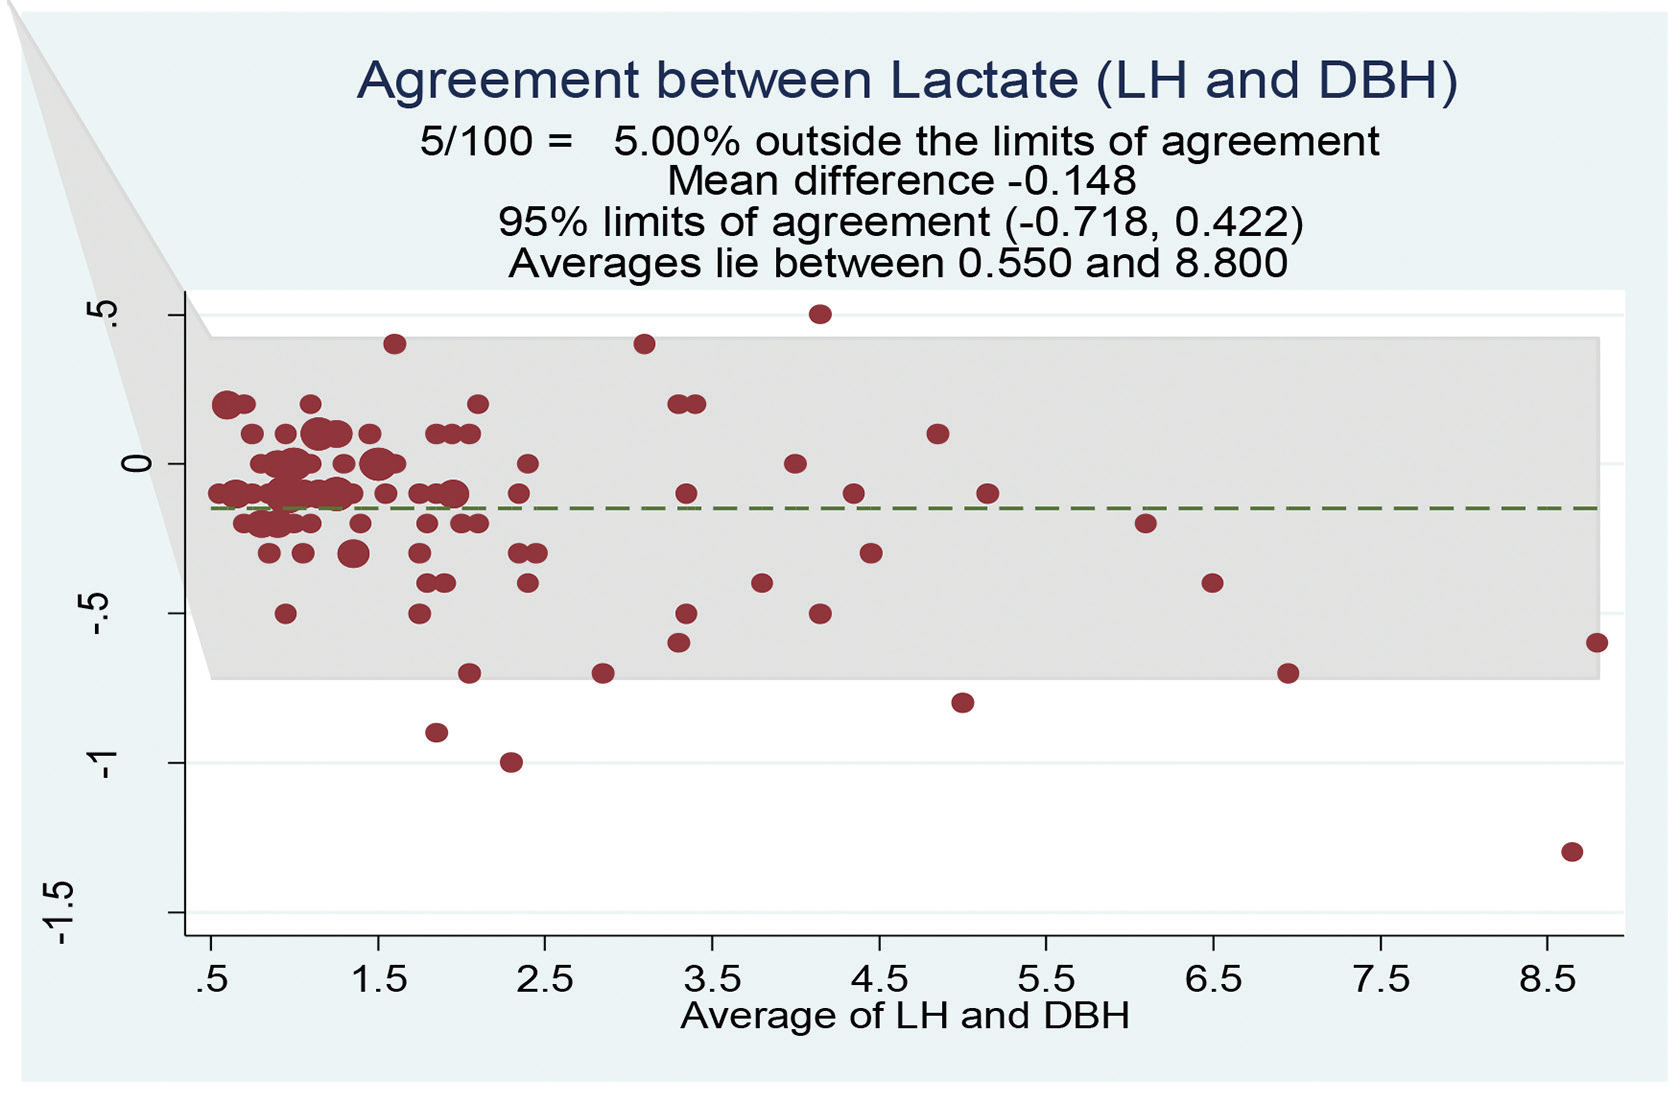
- Bland–Altman plot of lactate (mmol/L) for the LH group was comparable with that of the DBH group. DBH, dry bound heparin; LH, liquid heparin.
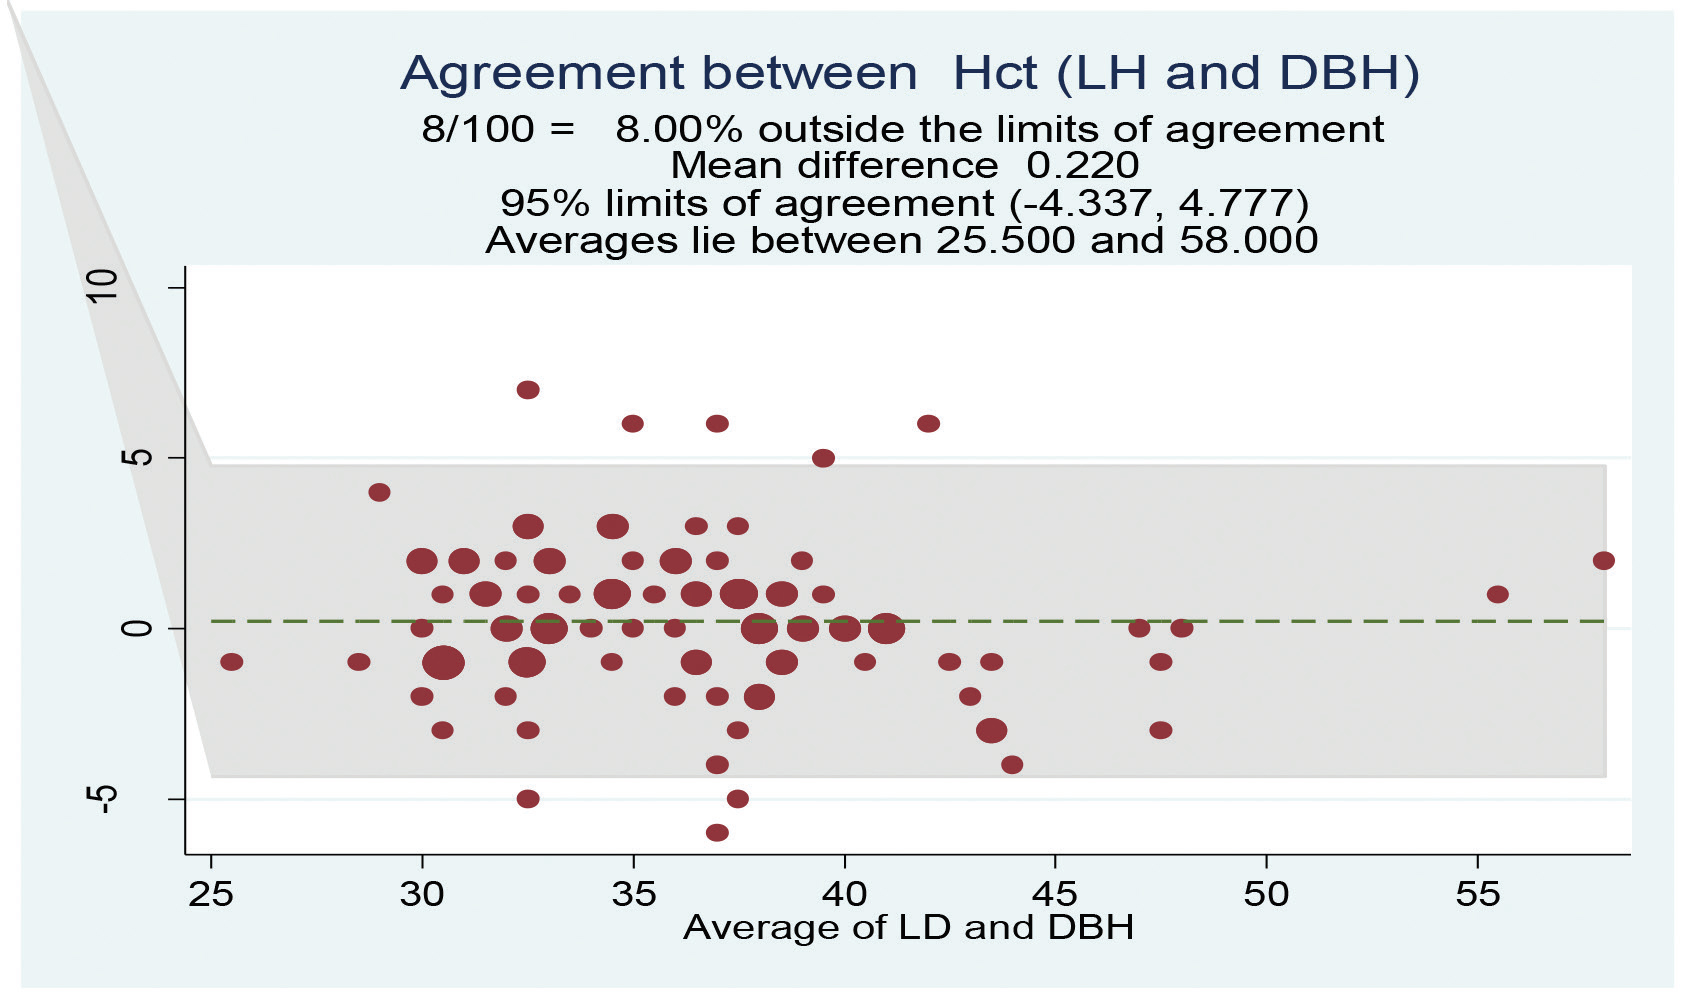
- Bland–Altman plot of hematocrit for the LH group was comparable with that of the DBH group. DBH, dry bound heparin; LH, liquid heparin.
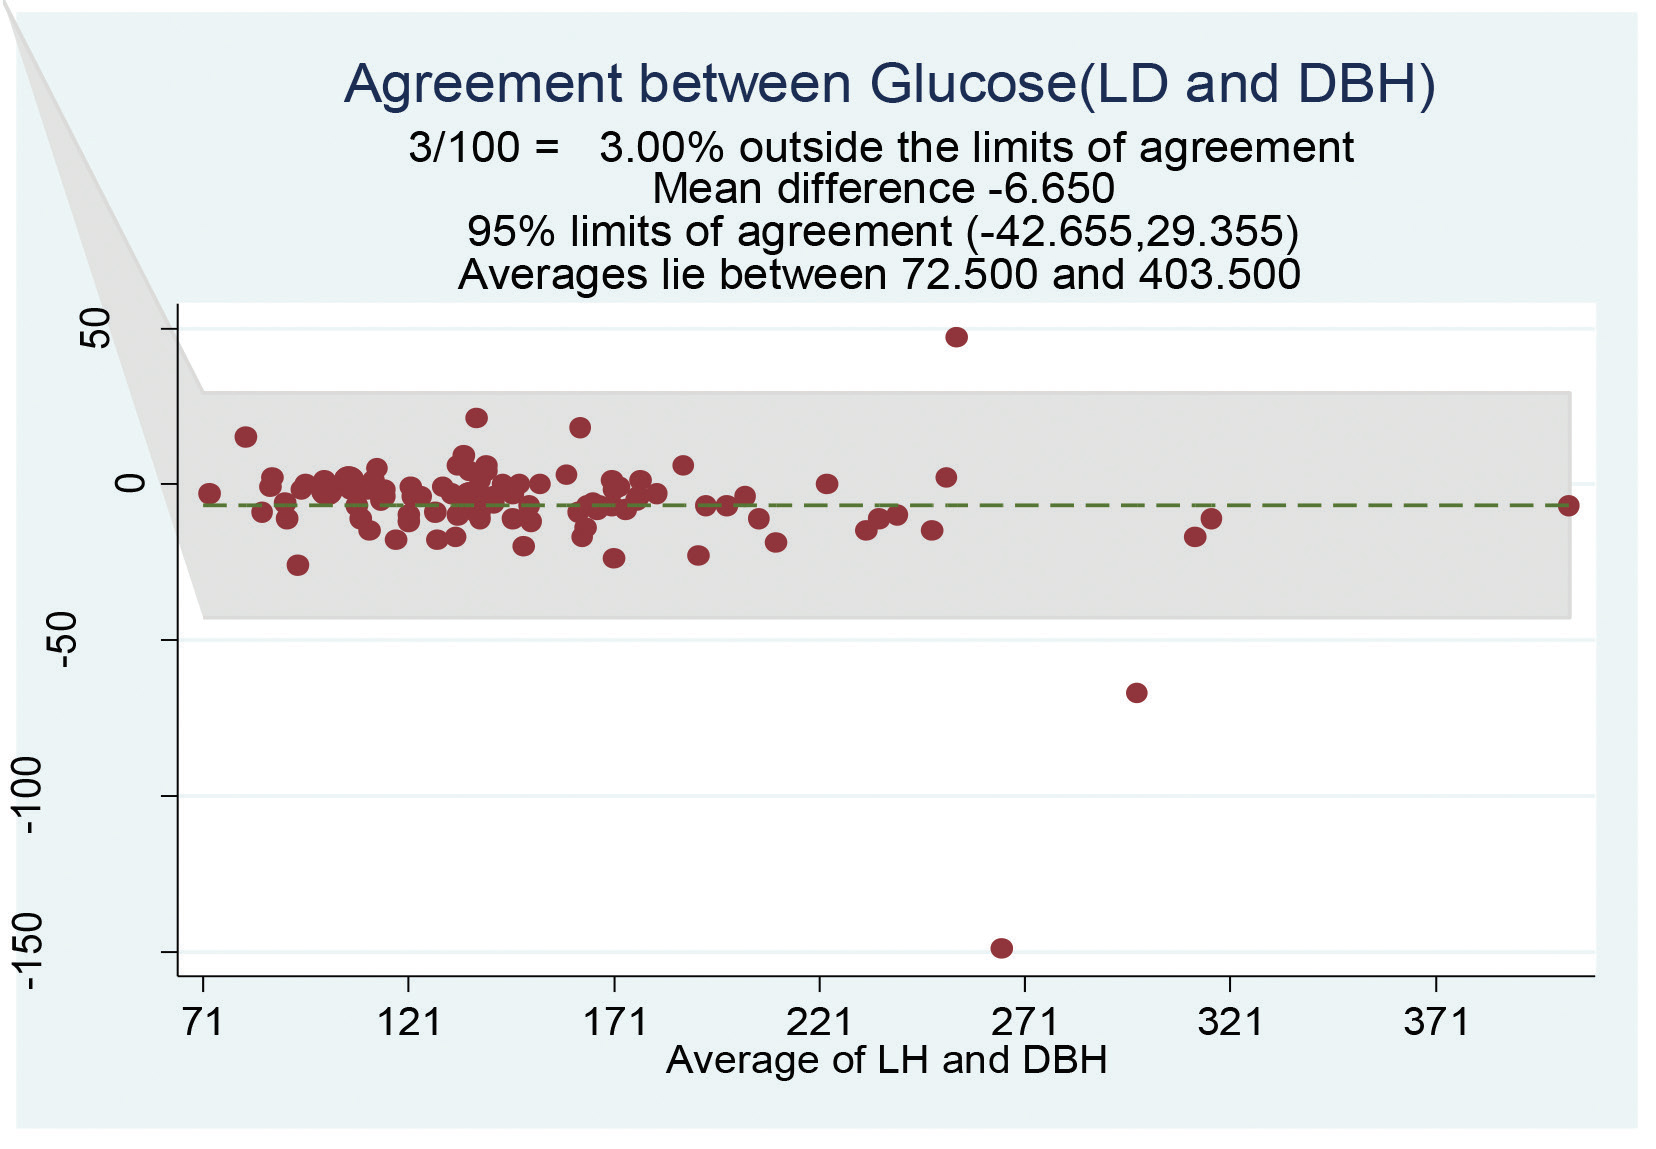
- Bland–Altman plot of glucose for the LH group was comparable with that of the DBH group. DBH, dry bound heparin; LH, liquid heparin.
Discussion
Unfractionated heparin (LH sodium) is widely used and the only suitable anticoagulant for blood sampling for BG analysis. Although an error is quite possible during BG analysis due to the variability of sample volume, dilution, binding, and combining effects of LH, such errors were generally thought to be of theoretical but may be of practical importance and still LH is anticoagulant of choice for BG sampling in many ICUs.1 The World Health Organization mentioned that 8 to 12 IU/mL of LH should be used in BG analysis, but the exact quantification is not possible in many situations in this LH method, which may lead to errors in BG analysis,5 although it is cost-effective and readily mixes up with blood.6 Many studies reported that preanalytic errors are the most common form of errors in BG analysis and include hemolysis, effect of temperature, use of plastic syringes, presence of air bubble, delay in sample transport, dilution effects of LH, manufacturing differences among syringe preparation, microclotting in the sample, and error in BG analyzer.7, 8, 9
In our study, we compared the effects of heparin on BG parameters between customized self-prepared LH syringes (type 1) and commercially available DBH syringe (type 2) in adult patients in cardiac surgical ICU because they represented two commonly witnessed practices of syringes at our institute.
In this study, all the respiratory parameters such as a pO2, pCO2, and SaO2 decreased in the LH group than the DBH group but did not show statistically significant difference and had narrow LOA, with TEa limits of sample of 8% for pO2 and pCO2 and zero for SaO2, and results did not show clinical significance between the two groups. Very minimal mean difference was found between the two groups for pH (Fig. 1) and only 3% samples were displaced outside the TEa limits. Hutchison et al and Ordog et al studied the effects of increasing LH on BG analysis and showed that pH value was not affected till 40% dilution of blood samples, but the values of pCO2, HCOshowed an inverse relation as LH volume.10, 11 This may be due to the buffering effects of the oxyhemoglobin, plasma proteins, and changes in pCO2 and HCO, and could not probably be due to heparin salts.10, 11
In this study, we observed that all electrolytes were lower in the LH sampling group when compared with the DBH group, but the mean difference, LOA, and proportion of TEa beyond limits followed this order, but all were statistically insignificant: Mg2+ followed by K+, Ca2+, and, finally, Na+ and Cl–. Shin et al observed that LH anticoagulant produces more negative bias on Mg2+ than Ca , and results were similar to our study.12 But Chantler and Cox found a good correlation between LH and DBH in their study.13
Until now, no study has analyzed and compared all electrolytes between both types of sampling in cardiac surgical intensive care settings in the adult population. Our study results of electrolytes were comparable with previous studies that showed that excessive heparin lead to an underestimation of positively charged ions such as K+, Ca2+, and Na due to the dilutional and direct binding effects of LH syringe group.12, 14, 15 Chhapola et al and Morimatsu et al in their studies compared the point-of-care testing using heparinized syringe and central laboratory nonheparinized testing and revealed that the decreased levels of K+ and Na in the heparin group may be due to the dilution effects.15, 16 Similar to previous studies, Cl–came out to be the least affected ion with the least mean difference, with only 3% beyond TEa limits in our study too. However, all electrolytes are statistically comparable in the LH and DBH groups.
Sandler and Goldstein showed in their results that pCO2, K+, Na+, Ca2+, and Hb were falling >20% beyond the total allowable error, and Ca2+ and Na results were most affected in the 5,000 IU/mL group of sample than the 1,000 IU/mL cohort group.17 In our customized manual syringe preparation for regular sampling for BG analysis, we use 2,500 units (0.5 mL) of heparin to rinse 2-mL syringes, which seemed to be most appropriate without affecting the results of respiratory, metabolic, and electrolyte analytes when compared with the standard commercially prepared DBH syringes.
As per our study, though the lactate levels increased in the LH group than the DBH group, it did not show statistically relevant difference, and 5% samples were beyond TEa limits. BE was surprisingly increased in the DBH group than the LH group but did not show statistical significance, with 7% samples beyond TEa limits. Delay in the analysis of BG sample can increase blood lactate levels due to anaerobic metabolism.18 Calatayud and Tenías studied the effect of time, temperature, and blood cell count on lactate levels in heparinized samples and showed that as delay time progresses for analysis at room temperature, parallel lactate levels rise.18 BG sample should be analyzed <5 minutes of collection to eliminate the unnecessary time-related error of lactate estimation.19 Chhapola et al demonstrated poor agreement between LH and DBH for the BG parameters pCO2, pO2, HCO3–, Na+, K+, and Cl and thus are not comparable, but for pH and lactate, two study group syringes can be interchanged in pediatric ICU.20 But as per our study for all the parameters, DBH and LH syringes can be interchanged in adult cardiac surgical ICUs. Chhapola et al also studied the effects of varying volume of heparin on blood parameters and concluded that as the amount of heparin increases in sample syringe, the values of pH, pCO2, HCO, Na , and Hb were decreased.21
A study by Hedberg et al with four different volume of samples compared commercial DBH syringes and showed that low-volumes samples were associated with significant errors in BG, electrolyte, and lactate measurements.22 Yip et al also got similar results: negative bias in positive ions were more seen in the pediatric population than adults.23
Summary
-
Among respiratory parameters, pO2 (mm Hg) and pCO2 (mm Hg) showed wide LOA with acceptable sample beyond TEa of 8% for both, but SaO2% did not show any mean difference between two study groups, with nil sample number beyond TEa% limits.
-
pH was comparable between groups, with less mean bias and only 3% sample beyond TEa limits.
-
Among the electrolyte, Mg2+ (mmol/L), K+ (mmol/L), and Ca2+ (mmol/L) showed negligible mean difference and good agreement with 6, 5, and 5% of sample beyond TEa of limits, respectively, and Cl–(mmol/L) was the least affected one.
-
Among the metabolic analytes, BE and lactate showed a difference between the two study groups, with 7 and 5% of sample beyond TEa limits, respectively.
-
Hct showed minimal mean difference than Hb, with sample beyond TEa limits of 8 and 3%, respectively.
-
Our study results did not show any clinical difference in LH and DBH syringes for BG analysis.
-
None of the previous studies have proven the comparability between the LH and DBH syringes for all the parameters in BG readings until now.
-
We believe that this result mainly depends on the quality of technics of sampling and titration while preparing LH syringes.
Limitations
Although all our study results were comparable between both the LH and DBH groups with a negligible mean bias, there are some limitations in our study deign. It was restricted to the adult population only and included all types of adult cardiac surgical patients. Samples were collected from existing arterial lines after discarding the dead space volume. It was a single-center and small study. We did not compare our observed bias with desirable bias specifications given by Ricós al.24
Conclusion
Our study results have clearly showed that the LH and DBH syringes were comparable for all the BG parameters analyzed from arterial blood. We did not find any significant statistical difference among the various respiratory, metabolic, and electrolytes, which may be attributed to the appropriate manual preparation of LH syringes for sampling and of course the good technic of sampling, handling, and ready analyzing.
Conflict of Interest
None.
Funding None.
References
- Preanalytical considerations in blood gas analysis. Biochem Med (Zagreb). 2013;23(1):19-27.
- [Google Scholar]
- The use of heparin in preparing samples for blood-gas analysis. O Med Lab Obs. 2007;39(10):16-18, 20, quiz 22–23.
- [Google Scholar]
- Procedures for Collection of Arterial Blood Specimens. In: Approved Standard—Fourth Edition. Wayne, PA: NCCLS; 2004.
- [Google Scholar]
- The effects of different syringe volume, needle size and sample volume on blood gas analysis in syringes washed with heparin. Biochem Med (Zagreb). 2012;22(2):189-201.
- [Google Scholar]
- World Health Organization. Use of anticoagulants in diagnostic laboratory investigations. https://apps.who.int/iris/handle/10665/65957. Accessed January 31, 2020
- Heparin release is insufficient in syringes with platelets as heparin source. Clin Chim Acta. 2008;395:187. (1-2)
- [Google Scholar]
- Effects of blood clots on measurements of pH and blood gases in critical care analyzers. Point Care. 2011;10:186-188.
- [Google Scholar]
- Blood gas analysis: effect of air bubbles in syringe and delay in estimation. Br Med J (Clin Res Ed). 1982;284:923-927. (6320)
- [Google Scholar]
- Arterial blood gas analysis: potential errors due to the addition of heparin. Anaesth Intensive Care. 1978;6(3):251-255.
- [Google Scholar]
- Too much heparin: possible source of error in blood gas analysis. Br Med J (Clin Res Ed). 1983;287:1131-1132. (6399)
- [Google Scholar]
- Liquid heparin anticoagulant produces more negative bias in the determination of ionized magnesium than ionized calcium. Yonsei Med J. 2006;47(2):191-195.
- [Google Scholar]
- Self-prepared heparinized syringes for measuring ionized magnesium in critical care patients. Br J Anaesth. 1999;83(5):810-812.
- [Google Scholar]
- Use of novel preparations of heparin to eliminate interference in ionized calcium measurements: have all the problems been solved? Clin Chem. 1994;40(4):508-509.
- [Google Scholar]
- A comparative study on reliability of point of care sodium and potassium estimation in a pediatric intensive care unit. Indian J Pediatr. 2013;80(9):731-735.
- [Google Scholar]
- Comparison of point-of-care versus central laboratory measurement of electrolyte concentrations on calculations of the anion gap and the strong ion difference. Anesthesiology. 2003;98(5):1077-1084.
- [Google Scholar]
- The effect of different forms of heparin on point-of-care blood gas analysis. S Afr Med J. 2018;108(3):224-229.
- [Google Scholar]
- Effects of time, temperature and blood cell counts on levels of lactate in heparinized whole blood gas samples. Scand J Clin Lab Invest. 2003;63(4):311-314.
- [Google Scholar]
- Effects of syringe material, sample storage time, and temperature on blood gases and oxygen saturation in arterialized human blood samples. Respir Care. 2006;51(7):732-736.
- [Google Scholar]
- Potential preanalytical errors in whole-blood analysis: effect of syringe sample volume on blood gas, electrolyte and lactate values. Scand J Clin Lab Invest. 2009;69(5):585-591.
- [Google Scholar]
- Is liquid heparin comparable to dry balanced heparin for blood gas sampling in intensive care unit? Indian J Crit Care Med. 2014;18(1):14-20.
- [Google Scholar]
- Use of liquid heparin for blood gas sampling in pediatric intensive care unit: a comparative study of effects of varying volumes of heparin on blood gas parameters. Indian J Crit Care Med. 2013;17(6):350-354.
- [Google Scholar]
- Heparin interference in whole blood sodium measurements in a pediatric setting. Clin Biochem. 2006;39(4):391-395.
- [Google Scholar]
- Current databases on biological variation: pros, cons and progress. Scand J Clin Lab Invest. 1999;59(7):491-500.
- [Google Scholar]