Translate this page into:
Factors Influencing Electrocardiogram Pattern in Children and Adolescents: A Systematic Review for Future Research

*Corresponding author: E. Thirumurugan, Research Scholar, Department of Allied Health Science, Srinivas University, Karnataka, India. thiruahs1002@gmail.com
-
Received: ,
Accepted: ,
How to cite this article: Thirumurugan E, Dias E, Karthick R. Factors Influencing Electrocardiogram Pattern in Children and Adolescents: A Systematic Review for Future Research. J Card Crit Care TSS. 2024;8:85-94. doi: 10.25259/JCCC_74_2023
Abstract
An electrocardiogram (ECG) is a diagnostic tool that can identify heart conditions and offer valuable information about electrical activity and age-related changes. Our primary concern is studying ECG changes related to age, gender, and body mass index (BMI) for the benefit of researchers and clinicians. A comprehensive search for relevant literature was conducted in the PubMed, Embase, and Scopus databases. The selection criteria were limited to original papers published between January 1, 2015, and December 31, 2022, that were deemed eligible. We executed a meticulous selection process that involved eliminating duplicates, screening abstracts and full texts, and manually adding some articles. During the full-text screening process, we excluded articles that were not relevant to our study. Ultimately, we included only nine observational studies that fulfilled our eligibility criteria. Our primary objective was to determine the factors that influence the ECG pattern in children and adolescents. This review systematically highlights the significance of identifying ECG patterns that could be correlated to factors such as age, gender, and BMI. Identifying such patterns may play a crucial role in improving the diagnostic accuracy of ECG. Physicians who fail to recognize these patterns may mistakenly endanger their patients’ lives.
Keywords
Electrocardiogram
Children and adolescents
Electrocardiogram pattern
Pediatric cardiology
Electrocardiogram changes in children

INTRODUCTION
The Electrocardiogram (ECG) is an extremely valuable tool for diagnosing heart conditions in a clinical setting. It offers critical insights into the heart’s electrical activity, encompassing its rhythm, rate, and overall health.[1] The most observable age-related alterations in ECG parameters occur during two major transitional periods: from neonatal life to infancy and later from childhood to adolescence. During these critical periods, children undergo significant physical, cognitive, and sexual development. Middle childhood, which coincides with primary school attendance, is characterized by swift changes in various aspects of its development. These changes, such as growth and maturation of the cardiovascular system, can significantly influence the interpretation of ECGs in this age group.[2-4] Despite the existing clinical knowledge, uncertainties still exist as every problem requires a unique approach. Therefore, it is crucial to conduct careful studies to address specific issues. Our systematic review aims to provide an update on the factors that impact the interpretation of ECG patterns in children and adolescents. Our focus is on ECG changes that may be linked to age, gender, and body mass index (BMI), providing valuable insights for both researchers and clinicians.
METHODOLOGY
Design
The objective of this systematic review is to identify the factors that contribute to the alteration of children’s ECG patterns. To achieve a more comprehensive understanding of specific facets of linked knowledge, this study involves analyzing the presently available data on the research objective. A thorough search was conducted, and the publications were evaluated in light of the predetermined inclusion and exclusion criteria.
Research question
We aim to answer the main question confidently:
In recent studies, which factors have recently been identified as influencing ECG alterations in healthy children?
Eligibility criteria for the selection of studies
TM and JJ, two independent researchers, carried out the literature search. In addition, we conducted a thorough manual search of the references cited in the relevant studies and related publications to identify any new research that could be relevant to our investigation. Any discrepancies were resolved through conversation. In the event of a disagreement arising from the findings of the initial two investigators, the final decision will be entrusted to the third investigator, ED. Studies that were duplicates were eliminated. We included articles published from January 1, 2015, to 31 December, 2022. Our inclusion criteria were as follows: (1) children aged 6–12 years; (2) adolescents aged 12–17 years; and (3) comparing patterns of ECG variation based on age, race, and BMI. Studies were disqualified if they matched the following requirements: (1) articles written in languages other than English and (2) articles containing study designs such as letters to the editor, literature reviews, systematic reviews, meta-analyses, case reports, case series, or correspondence. In cases where multiple published articles from the same trial addressed the same outcome of interest, preference was given to the study with a longer research duration. The outcome of interest pertains to the identification of the factors influencing the ECG pattern in children and adolescents.
Search strategy
In accordance with the Preferred Reporting Items for Systematic Reviews and Meta-analyses (PRISMA) statement guidelines and utilizing a predetermined search strategy, we performed a structured search to identify studies pertaining to the ECG variation patterns in children and adolescents. Our search was conducted across multiple renowned databases, including PubMed, Proquest, EBSCOhost, and Clinicaltrial.gov, from their inception until April 2023. We used MeSH phrases and (Title/Abstract) in conjunction with specific keywords to narrow down our search: “Normal Electrocardiogram,” “Normal ECG,” “ECG pattern in children,” “Electrocardiogram pattern in adolescents,” and “Normal Electrocardiogram pattern in children,” “Normal ECG values,” “ECG reference values,” “Electrocardiogram reference values,” “Pediatrics,” “Pediatrics ECG,” “children,” “adolescents,” and “ECG Waves.”
Study selection and data collection
The examination of the title, abstract, and entire text of each article was conducted to identify the relevant studies. Data extraction was carried out to gather information from the included studies, including the first author, publication year, ECG parameters such as heart rate, QRS axis, QRS duration, P wave axis, P wave amplitude, T wave axis, PR interval, RR interval, QT duration, and QTc duration. In addition, ECG leads, including unipolar leads (aVR, aVL, and aVF), bipolar leads (Lead-I, II, and III), and chest leads (V1–V6), as well as ECG amplitudes (mm) of various leads were recorded. Moreover, the data were analyzed with respect to age, gender, race, and BMI in relation to the study design and the type of rhythm. A maximum of two emails were sent to the corresponding author of the studies to ask for access to the missing data.
RESULTS
We conducted a thorough study selection process that involved removing duplicates, screening abstracts and full texts, and manually adding some articles. We excluded articles that were irrelevant to our study during the full-text screening process. The flow diagram depicted in Figure 1 presents the PRISMA methodology and provides an elaborate overview of the selection process utilized in this study. Ultimately, we included only nine observational studies that met our eligibility criteria. The description of the studies that were included is outlined in Table 1.
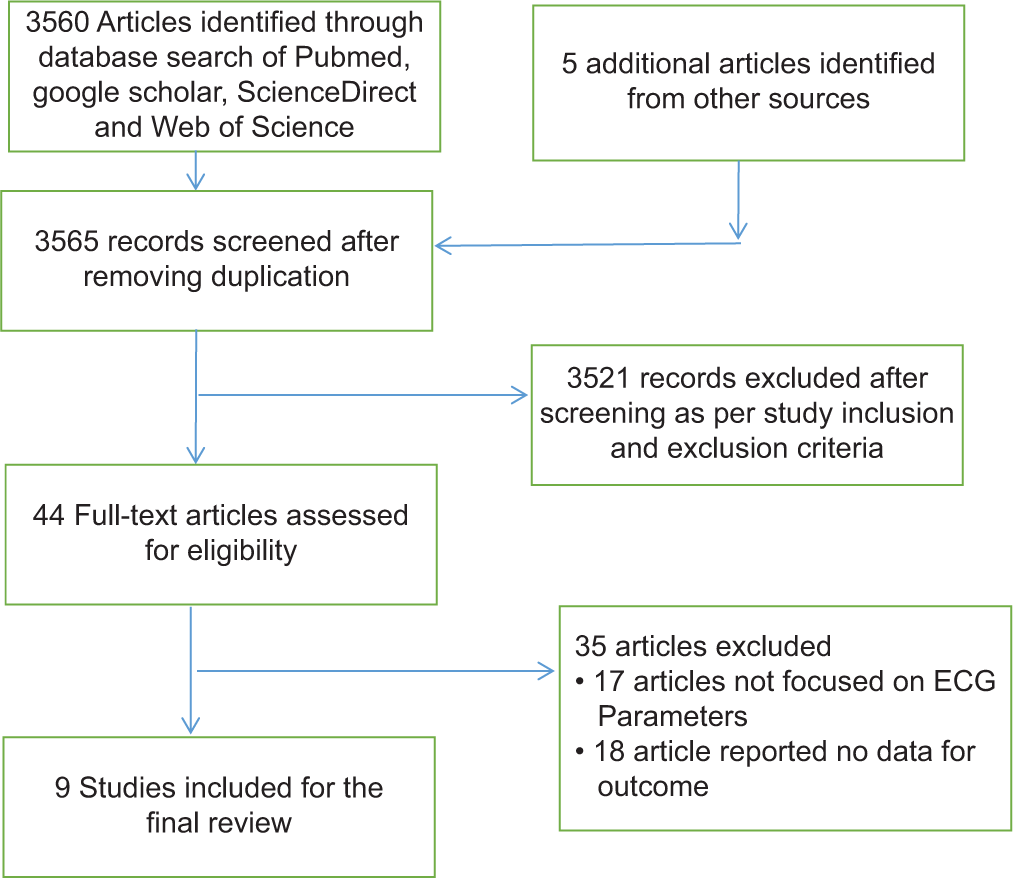
- The systematic review methodology according to the recommendations for systematic reviews.
| S. No. | First author | Study type | Country | Population | Study purpose | ECG findings |
|---|---|---|---|---|---|---|
| 1. | Aliyu and Ibrahim[5] | Cross- sectional. | Kano, Nigeria | 650 patients (Male-53.3%, Female-46.7%) | To establish reference ranges and any gender differences in the ECG characteristics of Nigerian children. | • Significant sex difference in the R-wave amplitude in the precordial leads V2, V3, V5, and V6 in the three age groups. • The male population has higher R wave amplitudes than the female. |
| 2. | Gaikwad et al.[6] | Cross- sectional. | Nandyal, Kurnool District. | 350 patients (Male-53.3%, Female-46.7%) | To establish reference ranges and any gender differences in the ECG characteristics of children in Nandyal, Kurnool District. | • Significant sex difference in the R wave amplitude in the precordial leads V2, V3, V5, and V6 in the three age-groups. • The male population has higher amplitudes than the female. |
| 3. | Munir[7] | Cross- sectional. | Palakkad, Kerala | 450 patients (Male-48.3%, Female-51.7%) | To establish reference ranges and any gender differences in the ECG characteristics of children in Palakkad District, Kerala | • Significant sex difference in the R wave amplitude in the precordial leads V2, V3, V5, and V6 in the three age-groups. • The male population having higher amplitudes than the female. |
| 4. | Lue et al.[8] | Cross- sectional. | Taipei, Taiwan | 898 patients (Male-53.5%, Female-46.4%) | To establish the normal ECG standards in male and female adolescents. | • ECG sex difference began to appear the earliest at ages 6–9 years, and it occurred mostly at ages 9–13 years and 13–18 years, reflecting the anatomical and physiological consequences of puberty. |
| 5. | Uygur and Aydoğdu[9] | Cross- sectional. | Turkish children in Aydın. | 1163 patients (Male-52.6%, Female-47.4%) | To establish the normal pediatric ECG limits of healthy Turkish children aged 0–16 years in Aydın. | • Observed differences in various electrocardiograms parameters could be related to biologic variability and to some technical details such as precordial electrode placement and visual checking of the records in addition to race. |
| 6. | Lue et al.[10] | Cross- sectional. | Taipei, Taiwan | 1884 patients | To establish the standards reflecting the growth and development of the heart in infants, children and adolescents | • Complete set of normal ECG standards of 15 key parameters from birth to adolescents is established. |
| 7. | Sun et al.[11] | Cross- sectional observational study | Shenyang (China). | 5556 patients | To determine the effect of obesity on electro cardiographic variables | • Longer PR intervals, wider QRS duration and a leftward shift of frontal P-wave, QRS and T-wave axes, independent of age, gender, ethnicity, and blood pressure. |
| 8. | Sadoh et al.[12] | Cross- sectional descriptive study | Benin City, Nigeria. | 98 patients | To determine the ECG and echocardiography findings in adolescent school children. | • The children with prolonged QTc had significantly bigger LVM compared to those with normal QTc duration irrespective of the BMI status. |
| 9. | Sunitha et al.[13] | Cross- sectional | Davangere | 150 patients | To assess the ECG changes in obese asymptomatic male children and to compare with that of normal male children group. | • Heart rate were significantly higher in obese children compared to controls |
BMI: Body mass index, ECG: Electrocardiography, LVM: Left ventricle mass.
DISCUSSION
The interpretation of ECGs in pediatric patients can prove to be a challenging task for physicians and pediatricians alike. The reason for this lies in the fact that the normal ECG findings, such as heart rate, rhythm, axis, intervals, and morphology, undergo changes as a child progresses from the newborn stage to adolescence.[4] This review is important because ECG is widely used across the world. It highlights that doctors who fail to recognize these changes may unknowingly put their patients’ lives at risk. Some major ECG results include:
Studies comparing the lead-independent ECG indices with the age and gender
Heart rate
Four studies were selected for analysis, all of which demonstrated a significant elevation in heart rate with advancing age, with female cohorts exhibiting higher average values than their male counterparts [Table 2].
| Variables | Gender | Aliyu and Ibrahim (2015).[5] | Gaikwad et al., (2015).[6] | Munir (2016).[7] | Lue et al., (2018).[8] | ||||||||
|---|---|---|---|---|---|---|---|---|---|---|---|---|---|
| 5–7 years | 8–11 years | 12–15 years | 5–7 years | 8–11 years | 12–15 years | 5–7 years | 8–11 years | 12–15 years | 6–9 years | 9–13 years | 13–18 years | ||
| Heart rate (bpm) | M | 94±10 | 80±7 | 75±7 | 92+10 | 81+7 | 77+7 | 92+10 | 81+7 | 77+7 | 94±14.09 | 89±13.91 | 78±14.95 |
| F | 96±12 | 82±5 | 78±5 | 96+12 | 86+5 | 79+5 | 96+12 | 86+5 | 79+5 | 93±15.48 | 93±13.96 | 82±13.86 | |
| QRS axis (°) | M | 80±5 | 65±10 | 60±10 | 80+5 | 65+10 | 60+10 | 80+5 | 65+10 | 60+10 | 66±17.89 | 66±19.81 | 66±25.98 |
| F | 75±7 | 60±10 | 55±9 | 75+7 | 60+10 | 55+9 | 75+7 | 60+10 | 55+9 | 68±19.65 | 65±19.66 | 68±18.42 | |
| P-wave axis (°) | M | 55±7 | 50±8 | 45±10 | 55+7 | 50+8 | 45+10 | 55+7 | 50+8 | 45+10 | 40±21.71 | 41±23.73 | 45±0.32.14 |
| F | 50±7 | 45±8 | 45±10 | 50+7 | 45+8 | 45+10 | 50+7 | 45+8 | 45+10 | 39±20.13 | 39±23.20 | 42±24.09 | |
| T-wave axis (°) | M | 50±8 | 35±10 | 30±9 | 50+8 | 35+10 | 30+9 | 50+8 | 35+10 | 30+9 | 37±14.57 | 43±14.01 | 44±16.47 |
| F | 40±10 | 35±15 | 30±10 | 40+10 | 35+15 | 30+10 | 40+10 | 35+15 | 30+10 | 32±17.47 | 34±14.30 | 32±17.25 | |
| P-wave amplitude (mV) | M | 0.1±0.1 | 0.2±0.1 | 0.2±0.1 | 0.1+0.1 | 0.2+0.1 | 0.2+0.1 | 0.1+0.1 | 0.2+0.1 | 0.2+0.1 | 0.10±0.04 | 0.09±0.05 | 0.09±0.05 |
| F | 0.2±0.1 | 0.2±0.1 | 0.2±0.1 | 0.2+0.1 | 0.2+0.1 | 0.2+0.1 | 0.2+0.1 | 0.2+0.1 | 0.2+0.1 | 0.10±0.05 | 0.09±0.04 | 0.09±0.04 | |
| P-wave duration (ms) | M | 80±10 | 80±10 | 80±10 | 80+10 | 80+10 | 80+10 | 80+10 | 80+10 | 80+10 | - | - | - |
| F | 76±10 | 80±10 | 80±10 | 76+10 | 80+10 | 80+10 | 76+10 | 80+10 | 80+10 | - | - | - | |
| PR-interval (ms) | M | 120±20 | 130±20 | 140±20 | 120+20 | 130+20 | 140+20 | 120+20 | 130+20 | 140+20 | 132±15.04 | 134±14.07 | 140±19.07 |
| F | 110±20 | 120±20 | 130±15 | 110+20 | 120+20 | 130+20 | 110+20 | 120+20 | 130+15 | 130±15.04 | 135±15.80 | 141±17.11 | |
| QT-interval (ms) | M | 327±22 | 364±10 | 376±7 | 327+22 | 364+10 | 376+7 | 327+22 | 364+10 | 376+7 | 337±24.13 | 339±21.69 | 351±23.34 |
| F | 316±16 | 355±10 | 350±10 | 316+16 | 355+10 | 350+10 | 316+16 | 355+10 | 350+10 | 336±23.59 | 334±21.61 | 354±28.62 | |
| QTc | M | 410±20 | 420±20 | 420±24 | 410+20 | 420+20 | 420+24 | 410+20 | 420+20 | 420+24 | 423±21.46 | 413±19.78 | 401±24.71 |
| F | 400±15 | 410±20 | 400±30 | 400+15 | 410+20 | 400+30 | 400+15 | 410+20 | 400+30 | 417±17.32 | 417±18.89 | 413±20.39 | |
| QRS duration (ms) | M | 59±15 | 60±15 | 80±15 | 59+15 | 60+15 | 80+15 | 59+15 | 60+15 | 80+15 | 89±14.37 | 91±8.24 | 100±9.60 |
| F | 56±10 | 58±15 | 78±10 | 56+10 | 58+15 | 78+10 | 56+10 | 58+15 | 78+10 | 85±7.38 | 87±8.73 | 91±8.13 | |
ECG: Electrocardiography, bpm: Beats per minute, ms: Milliseconds
QRS-axis
The QRS axis is a representation of the electrical axis of the heart on the frontal plane. Among four studies, 3 (75%) reported that the mean QRS axis in three age groups was within the normal range of 0–90°. This axis has decreased gradually with age in the male population, and higher mean values are recorded.
P wave and T wave-axis
In 3 (75%) of the four studies reported, the P-wave and T-wave axes gradually decreased with age in the male and female populations. In contrast, the average axes of P-wave and T-wave in all three age groups were observed to be within the normal range of 0–90°. Furthermore, 3 (75%) of the four studies reported that the higher p wave amplitudes were recorded in the 8–11 year and 12–15 year age groups.
P-wave and QRS-duration
Three (75%) of the four studies reported no significant difference in the P wave duration in the three age groups. All 4 (100%) studies reported an increase in the mean duration of the QRS complex with advancing age. Furthermore, the average duration of the QRS complex in females was consistently lower than that of males across all three age groups.
PR-interval and QT-interval
All four studies (100%) unequivocally reported a consistent rise in the PR interval as age increases, with three of them (75%) documenting higher mean values in males. After analyzing four studies, it has been conclusively established that the male population exhibits a higher mean duration of the QT and QTc intervals. Three studies found that the average QT interval duration was lower for females than males in all three age groups. In addition, three studies reported that the QT interval consistently increased with age in males.
The differences observed in various ECG parameters between healthy male and female child may be attributed to a complex interplay of anatomical, structural, hormonal, autonomic, and genetic factors. Therefore, when interpreting the clinical relevance of heart rate, QRS duration, QRS amplitude, ST-segment deviation, and QT interval, both sex and age-based ECG standards should be considered, both at rest and during activity.
Studies comparing the lead-dependent ECG indices with the AGE and gender
R-wave amplitude
The analysis of four studies has revealed that tall R-waves are primarily noticeable in leads V5 and V6, located in the left precordial leads. Specifically, among adolescents aged 12–15 years, lead V5 showcases the highest amplitude with an average value of 3.7 ± 0.5 millivolts. These findings emphasize the importance of carefully interpreting ECG recordings in this age group, especially concerning these specific leads. In all age groups, the lead aVR had the lowest amplitude compared to other leads, averaging 0.1–0.2 mV. In three out of four studies conducted, a gradual increase in the R-wave magnitude was observed from right-sided precordial leads to left-precordial leads. In addition, among the three age groups that were examined, males exhibited greater R-wave amplitudes in the left precordial leads compared to females in 75% of the studies [Tables 3-5].
| Leads | Gender | Aliyu and Ibrahim (2015).[5] | Gaikwad et al., (2015).[6] | Munir, (2016).[7] | Lue et al., (2018).[8] | ||||||||
|---|---|---|---|---|---|---|---|---|---|---|---|---|---|
| 5–7 years | 8–11 years | 12–15 years | 5–7 years | 8–11 years | 12–15 years | 5–7 years | 8–11 years | 12–15 years | 6–9 years | 9–13 years | 13–18 years | ||
| V4R | M | 0.5±0.1 | 0.5±0.1 | 0.2±0.1 | 0.5+0.1 | 0.5+0.1 | 0.2+0.1 | 0.5+0.1 | 0.5+0.1 | 0.2+0.1 | - | - | - |
| F | 0.4±0.1 | 0.4±0.1 | 0.2±0.1 | 0.4+0.1 | 0.4+0.1 | 0.2+0.1 | 0.4+0.1 | 0.4+0.1 | 0.2+0.1 | - | - | - | |
| V1 | M | 0.9±0.3 | 0.8±0.3 | 0.8±0.3 | 0.9+0.3 | 0.8+0.3 | 0.8+0.3 | 0.9+0.3 | 0.8+0.3 | 0.8+0.3 | 0.4±0.2 | 0.3±0.19 | 0.3±0.24 |
| F | 0.9±0.3 | 0.8±0.3 | 0.7±0.3 | 0.9+0.3 | 0.8+0.3 | 0.7+0.3 | 0.9+0.3 | 0.8+0.3 | 0.7+0.3 | 0.3±0.1 | 0.2±0.16 | 0.2±0.17 | |
| V2 | M | 1.4±0.3 | 1.3±0.4 | 1.1±0.2 | 1.4+0.3 | 1.3+0.4 | 1.1+0.2 | 1.4+0.3 | 1.3+0.4 | 1.1+0.2 | 1.2±0.5 | 1.1±0.4 | 0.9±0.4 |
| F | 1.1±0.4 | 1.2±0.4 | 1.1±0.2 | 1.1+0.4 | 1.2+0.4 | 1.1+0.2 | 1.1+0.4 | 1.2+0.4 | 1.1+0.2 | 1.2±0.4 | 0.9±0.3 | 0.6±0.3 | |
| V3 | M | 1.4±0.2 | 1.2±0.3 | 1.1±0.3 | 1.4+0.2 | 1.2+0.3 | 1.1+0.3 | 1.4+0.2 | 1.2+0.3 | 1.1+0.3 | - | - | - |
| F | 1.2±0.2 | 1.2±0.4 | 1.1±0.3 | 1.2+0.2 | 1.2+0.4 | 1.1+0.3 | 1.2+0.2 | 1.2+0.4 | 1.1+0.3 | - | - | - | |
| V5 | M | 2.0±0.3 | 3.0±0.3 | 3.7±0.5 | 2.0+0.3 | 3.0+0.3 | 3.7+0.5 | 2.0+0.3 | 3.0+0.3 | 3.7+0.5 | 1.7±0.6 | 1.7±0.5 | 1.6±0.5 |
| F | 1.8±0.4 | 2.6±0.3 | 3.2±0.5 | 1.8+0.4 | 2.6+0.3 | 3.2+0.5 | 1.8+0.4 | 2.6+0.3 | 3.2+0.5 | 1.8±0.4 | 1.5±0.4 | 1.2±0.3 | |
| V6 | M | 1.3±0.3 | 2.4±0.4 | 2.5±0.4 | 1.3+0.3 | 2.4+0.4 | 2.5+0.4 | 1.3+0.3 | 2.4+0.4 | 2.5+0.4 | 1.4±0.4 | 1.4±0.42 | 1.24±0.4 |
| F | 1.2±0.3 | 2.2±0.4 | 2.3±0.4 | 1.2+0.3 | 2.2+0.4 | 2.3+0.4 | 1.2+0.3 | 2.2+0.4 | 2.3+0.4 | 1.5±0.5 | 1.3±0.40 | 1.05±0.3 | |
| I | M | 0.9±0.3 | 1.0±0.4 | 1.0±0.4 | 0.9+0.3 | 1.0+0.4 | 1.0+0.4 | 0.9+0.3 | 1.0+0.4 | 1.0+0.4 | - | - | - |
| F | 0.9±0.3 | 0.8±0.3 | 1.0±0.4 | 0.9+0.3 | 0.8+0.3 | 1.0+0.4 | 0.9+0.3 | 0.8+0.3 | 1.0+0.4 | - | - | - | |
| II | M | 1.2±0.3 | 1.3±0.4 | 1.4±0.3 | 1.2+0.3 | 1.3+0.4 | 1.4+0.3 | 1.2+0.3 | 1.3+0.4 | 1.4+0.3 | - | - | - |
| F | 1.0±0.3 | 1.1±0.4 | 1.3±0.3 | 1.0+0.3 | 1.1+0.4 | 1.3+0.3 | 1.0+0.3 | 1.1+0.4 | 1.3+0.3 | - | - | - | |
| III | M | 0.9±0.3 | 1.0±0.3 | 1.2±0.3 | 0.9+0.3 | 1.0+0.3 | 1.2+0.3 | 0.9+0.3 | 1.0+0.3 | 1.2+0.3 | - | - | - |
| F | 0.8±0.2 | 0.9±0.3 | 1.1±0.4 | 0.8+0.2 | 0.9+0.3 | 1.1+0.4 | 0.8+0.2 | 0.9+0.3 | 1.1+0.4 | - | - | - | |
| aVR | M | 0.2±0.1 | 0.2±0.1 | 0.2±0.1 | 0.2+0.1 | 0.2+0.1 | 0.2+0.1 | 0.2+0.1 | 0.2+0.1 | 0.2+0.1 | 0.1±0.1 | 0.1±0.1 | 0.1±0.1 |
| F | 0.2±0.1 | 0.2±0.1 | 0.2±0.1 | 0.2+0.1 | 0.2+0.1 | 0.2+0.1 | 0.2+0.1 | 0.2+0.1 | 0.2+0.1 | 0.1±0.1 | 0.1±0.1 | 0.1±0.1 | |
| aVL | M | 0.6±0.1 | 0.7±0.1 | 0.6±0.1 | 0.6+0.1 | 0.7+0.1 | 0.6+0.1 | 0.6+0.1 | 0.7+0.1 | 0.6+0.1 | - | - | - |
| F | 0.6±0.1 | 0.6±0.1 | 0.6±0.1 | 0.6+0.1 | 0.6+0.1 | 0.6+0.1 | 0.6+0.1 | 0.6+0.1 | 0.6+0.1 | - | - | - | |
| aVF | M | 1.0±0.2 | 1.0±0.2 | 1.2±0.2 | 1.0+0.2 | 1.0+0.2 | 1.2+0.2 | 1.0+0.2 | 1.0+0.2 | 1.2+0.2 | - | - | - |
| F | 1.0±0.2 | 1.0±0.1 | 1.1±0.3 | 1.0+0.2 | 1.0+0.1 | 1.1+0.3 | 1.0+0.2 | 1.0+0.1 | 1.1+0.3 | - | - | - | |
| Leads | Gender | Aliyu and Ibrahim, (2015).[5] | Gaikwad et al., (2015).[6] | Munir et al., (2016).[7] | Lue et al., (2018).[8] | ||||||||
|---|---|---|---|---|---|---|---|---|---|---|---|---|---|
| 5–7 years | 8–11 years | 12–15 years | 5–7 years | 8–11 years | 12–15 years | 5–7 years | 8–11 years | 12–15 years | 6–9 years | 9–13 years | 13–18 years | ||
| V4R | M | 2.0±0.3 | 2.1±0.4 | 2.2±0.4 | 2.0+0.3 | 2.1+0.4 | 2.2+0.4 | 2.0+0.3 | 2.1+0.4 | 2.2+0.4 | - | - | - |
| F | 2.0±0.4 | 2.0±0.3 | 2.1±0.4 | 2.0+0.4 | 2.0+0.3 | 2.1+0.4 | 2.0+0.4 | 2.0+0.3 | 2.1+0.4 | - | - | - | |
| V1 | M | 1.8±0.4 | 1.9±0.3 | 1.9±0.4 | 1.8+0.4 | 1.9+0.3 | 1.9+0.4 | 1.8+0.4 | 1.9+0.3 | 1.9+0.4 | 0.7±0.4 | 0.7±0.3 | 0.9±0.4 |
| F | 1.7±0.3 | 1.8±0.3 | 1.8±0.3 | 1.7+0.3 | 1.8+0.3 | 1.8+0.3 | 1.7+0.3 | 1.8+0.3 | 1.8+0.3 | 0.6±0.3 | 0.7±0.3 | 0.7±0.3 | |
| V2 | M | 1.7±0.1 | 2.0±0.2 | 2.0±0.1 | 1.7+0.1 | 2.0+0.2 | 2.0+0.1 | 1.7+0.1 | 2.0+0.2 | 2.0+0.1 | 1.3±0.5 | 1.3±0.5 | 1.6±0.6 |
| F | 1.6±0.1 | 1.8±0.1 | 2.0±0.1 | 1.6+0.1 | 1.8+0.1 | 2.0+0.1 | 1.6+0.1 | 1.8+0.1 | 2.0+0.1 | 1.2±0.5 | 1.2±0.6 | 1.1±0.5 | |
| V3 | M | 1.3±0.4 | 1.7±0.5 | 1.6±0.4 | 1.3+0.4 | 1.7+0.5 | 1.6+0.4 | 1.3+0.4 | 1.7+0.5 | 1.6+0.4 | - | - | - |
| F | 1.0±0.3 | 1.4±0.5 | 1.3±0.5 | 1.0+0.3 | 1.4+0.5 | 1.3+0.5 | 1.0+0.3 | 1.4+0.5 | 1.3+0.5 | - | - | - | |
| V5 | M | 0.4±0.2 | 0.3±0.2 | 0.3±0.1 | 0.4+0.2 | 0.3+0.2 | 0.3+0.1 | 0.4+0.2 | 0.3+0.2 | 0.3+0.1 | 0.3±0.2 | 0.3±0.2 | 0.3±0.2 |
| F | 0.3±0.2 | 0.3±0.2 | 0.3±0.1 | 0.3+0.2 | 0.3+0.2 | 0.3+0.1 | 0.3+0.2 | 0.3+0.2 | 0.3+0.1 | 0.3±0.2 | 0.2±0.2 | 0.2±0.2 | |
| V6 | M | 0.4±0.2 | 0.3±0.1 | 0.3±0.1 | 0.4+0.2 | 0.3+0.1 | 0.3+0.1 | 0.4+0.2 | 0.3+0.1 | 0.3+0.1 | 0.2±0.1 | 0.2±0.1 | 0.2±0.1 |
| F | 0.3±0.2 | 0.3±0.1 | 0.2±0.1 | 0.3+0.2 | 0.3+0.1 | 0.2+0.1 | 0.3+0.2 | 0.3+0.1 | 0.2+0.1 | 0.2±0.1 | 0.1±0.1 | 0.1±0.1 | |
| I | M | 0.3±0.1 | 0.3±0.1 | 0.3±0.1 | 0.3+0.1 | 0.3+0.1 | 0.3+0.1 | 0.3+0.1 | 0.3+0.1 | 0.3+0.1 | 0.1±0.1 | 0.1±0.1 | 0.1±0.1 |
| F | 0.2±0.1 | 0.3±0.1 | 0.2±0.1 | 0.2+0.1 | 0.3+0.1 | 0.2+0.1 | 0.2+0.1 | 0.3+0.1 | 0.2+0.1 | 0.1±0.1 | 0.1±0.14 | 0.1±0.1 | |
| II | M | 0.2±0.1 | 0.3±0.2 | 0.3±0.1 | 0.2+0.1 | 0.3+0.2 | 0.3+0.1 | 0.2+0.1 | 0.3+0.2 | 0.3+0.1 | 0.1±0.1 | 0.1±0.1 | 0.1±0.1 |
| F | 0.2±0.1 | 0.3±0.2 | 0.2±0.1 | 0.2+0.1 | 0.3+0.2 | 0.2+0.1 | 0.2+0.1 | 0.3+0.2 | 0.2+0.1 | 0.1±0.1 | 0.1±0.1 | 0.1±0.1 | |
| III | M | 0.3±0.2 | 0.3±0.2 | 0.3±0.1 | 0.3+0.2 | 0.3+0.2 | 0.3+0.1 | 0.3+0.2 | 0.3+0.2 | 0.3+0.1 | 0.1±0.1 | 0.13±0.14 | 0.1±0.1 |
| F | 0.3±0.1 | 0.3±0.1 | 0.2±0.1 | 0.3+0.1 | 0.3+0.1 | 0.2+0.1 | 0.3+0.1 | 0.3+0.1 | 0.2+0.1 | 0.0±0.0 | 0.08±0.10 | 0.08±0.1 | |
| aVR | M | 0.9±0.2 | 1.1±0.2 | 1.0±0.2 | 0.9+0.2 | 1.1+0.2 | 1.0+0.2 | 0.9+0.2 | 1.1+0.2 | 1.0+0.2 | - | - | - |
| F | 0.8±0.2 | 0.9±0.3 | 0.9±0.2 | 0.8+0.2 | 0.9+0.3 | 0.9+0.2 | 0.8+0.2 | 0.9+0.3 | 0.9+0.2 | - | - | - | |
| aVL | M | 0.3±0.2 | 0.4±0.2 | 0.4±0.2 | 0.3+0.2 | 0.4+0.2 | 0.4+0.2 | 0.3+0.2 | 0.4+0.2 | 0.4+0.2 | 0.2±0.2 | 0.2±0.2 | 0.3±0.2 |
| F | 0.3±0.1 | 0.3±0.2 | 0.4±0.2 | 0.3+0.1 | 0.3+0.2 | 0.4+0.2 | 0.3+0.1 | 0.3+0.2 | 0.4+0.2 | 0.3±0.2 | 0.2±0.2 | 0.2±0.2 | |
| aVF | M | 0.5±0.2 | 0.4±0.1 | 0.4±0.1 | 0.5+0.2 | 0.4+0.1 | 0.4+0.1) | 0.5+0.2 | 0.4+0.1 | 0.4+0.1 | 0.1±0.0 | 0.1±0.1 | 0.1±0.1 |
| F | 0.4±0.1 | 0.4±0.1 | 0.4±0.1 | 0.4+0.1 | 0.4+0.1 | 0.4+0.1 | 0.4+0.1 | 0.4+0.1 | 0.4+0.1 | 0.07±0.0 | 0.08±0.10 | 0.09±0.1 | |
| Leads | Gender | Aliyu and Ibrahim, (2015).[5] | Gaikwad et al., (2015).[6] | Munir et al., (2016).[7] | Lue et al., (2018).[8] | ||||||||
|---|---|---|---|---|---|---|---|---|---|---|---|---|---|
| 5–7 years | 8–11 years | 12–15 years | 5–7 years | 8–11 years | 12–15 years | 5–7 years | 8–11 years | 12–15 years | 6–9 years | 9–13 years | 13–18 years | ||
| V4R | M | 0.2±0.1 | 0.3±0.1 | 0.4±0.1 | 0.2+0.1 | 0.3+0.1 | 0.4+0.1 | 0.2±0.1 | 0.3±0.1 | 0.4±0.1 | - | - | - |
| F | 0.2±0.1 | 0.3±0.1 | 0.3±0.2 | 0.2+0.1 | 0.3+0.1 | 0.3+0.2 | 0.2±0.1 | 0.3±0.1 | 0.3±0.1 | - | - | - | |
| V1 | M | 0.3±0.1 | 0.3±0.1 | 0.5±0.1 | 0.3+0.1 | 0.3+0.1 | 0.5+0.1 | 0.3±0.1 | 0.3±0.1 | 0.5±0.1 | −0.30±0.1 | −0.22±0.14 | −0.07±0.1 |
| F | 0.3±0.1 | 0.3±0.1 | 0.4±0.1 | 0.3+0.1 | 0.3+0.1 | 0.4+0.1 | 0.3±0.1 | 0.3±0.1 | 0.4±0.1 | −0.2±0.1 | −0.20±0.1 | −0.14±0.1 | |
| V2 | M | 0.4±0.1 | 0.4±0.1 | 0.7±0.2 | 0.4+0.1 | 0.4+0.1 | 0.7+0.2 | 0.4±0.1 | 0.4±0.1 | 0.7±0.1 | 0.30±0.3 | 0.33±0.26 | 0.45±0.27 |
| F | 0.3±0.1 | 0.3±0.1 | 0.7±0.2 | 0.3+0.1 | 0.3+0.1 | 0.7+0.2 | 0.3±0.1 | 0.3±0.1 | 0.7±0.1 | 0.24±0.2 | 0.27±0.22 | 0.22±0.19 | |
| V3 | M | 0.3±0.1 | 0.4±0.1 | 0.8±0.2 | 0.3+0.1 | 0.4+0.1 | 0.8+0.2 | 0.3±0.1 | 0.4±0.1 | 0.8±0.1 | - | - | - |
| F | 0.3±0.1 | 0.4±0.1 | 0.7±0.2 | 0.3+0.1 | 0.4+0.1 | 0.7+0.2 | 0.3±0.1 | 0.4±0.1 | 0.7±0.1 | - | - | - | |
| V5 | M | 0.5±0.1 | 0.5±0.1 | 1.0±0.2 | 0.5+0.1 | 0.5+0.1 | 1.0+0.2 | 0.5±0.1 | 0.5±0.1 | 0.1±0.1 | 0.61±0.23 | 0.56±0.17 | 0.54±0.19 |
| F | 0.4±0.1 | 0.4±0.1 | 0.9±0.2 | 0.4+0.1 | 0.4+0.1 | 0.9+0.2 | 0.4±0.1 | 0.4±0.1 | 0.9±0.1 | 0.5±0.1 | 0.44±0.16 | 0.38±0.1 | |
| V6 | M | 0.4±0.1 | 0.4±0.1 | 0.9±0.2 | 0.4+0.1 | 0.4+0.1 | 0.9+0.2 | 0.4±0.1 | 0.4±0.1 | 0.9±0.1 | 0.55±0.2 | 0.46±0.15 | 0.41±0.16 |
| F | 0.4±0.1 | 0.4±0.1 | 0.9±0.1 | 0.4+0.1 | 0.4+0.1 | 0.9+0.1 | 0.4±0.1 | 0.4±0.1 | 0.9±0.1 | 0.45±0.1 | 0.38±0.14 | 0.32±0.1 | |
| I | M | 0.2±0.1 | 0.2±0.1 | 0.3±0.1 | 0.2+0.1 | 0.2+0.1 | 0.3+0.1 | 0.2±0.1 | 0.2±0.1 | 0.3±0.1 | 0.30±0.0 | 0.27±0.08 | 0.24±0.08 |
| F | 0.2±0.1 | 0.2±0.1 | 0.2±0.1 | 0.2+0.1 | 0.2+0.1 | 0.2+0.1 | 0.2±0.1 | 0.2±0.1 | 0.2±0.1 | 0.27±0.0 | 0.26±0.08 | 0.24±0.08 | |
| II | M | 0.2±0.1 | 0.2±0.1 | 0.2±0.1 | 0.2±0.1 | 0.2±0.1 | 0.2±0.1 | 0.2±0.1 | 0.2±0.1 | 0.2±0.1 | 0.37±0.10 | 0.38±0.12 | 0.35±0.13 |
| F | 0.2±0.1 | 0.2±0.1 | 0.2±0.1 | 0.2±0.1 | 0.2±0.1 | 0.2±0.1 | 0.2±0.1 | 0.2±0.1 | 0.2±0.1 | 0.32±0.1 | 0.30±0.12 | 0.27±0.1 | |
| III | M | 0.2±0.1 | 0.2±0.1 | 0.2±0.1 | 0.2±0.1 | 0.2±0.1 | 0.2±0.1 | 0.2±0.1 | 0.2±0.1 | 0.2±0.1 | 0.06±0.07 | 0.10±0.11 | 0.10±0.12 |
| F | 0.2±0.1 | 0.2±0.1 | 0.2±0.1 | 0.2±0.1 | 0.2±0.1 | 0.2±0.1 | 0.2±0.1 | 0.2±0.1 | 0.2±0.1 | 0.04±0.09 | 0.03±0.09 | 0.02±0.09 | |
| aVR | M | 0.2±0.1 | 0.2±0.1 | 0.2±0.1 | 0.2±0.1 | 0.2±0.1 | 0.2±0.1 | 0.2±0.1 | 0.2±0.1 | 0.2±0.1 | −0.33±0.09 | −0.32±0.09 | −0.29±0.09 |
| F | 0.2±0.1 | 0.2±0.1 | 0.2±0.1 | 0.2±0.1 | 0.2±0.1 | 0.2±0.1 | 0.2±0.1 | 0.2±0.1 | 0.2±0.1 | −0.29±0.08 | −0.28±0.09 | −0.25±0.08 | |
| aVL | M | 0.2±0.1 | 0.2±0.1 | 0.3±0.1 | 0.2±0.1 | 0.2±0.1 | 0.3±0.1 | 0.2±0.1 | 0.2±0.1 | 0.3±0.1 | 0.13±0.07 | 0.09±0.07 | 0.08±0.08 |
| F | 0.2±0.1 | 0.2±0.1 | 0.3±0.1 | 0.2±0.1 | 0.2±0.1 | 0.3±0.1 | 0.2±0.1 | 0.2±0.1 | 0.3±0.1 | 0.11±0.07 | 0.12±0.06 | 0.11±0.06 | |
| aVF | M | 0.3±0.1 | 0.2±0.1 | 0.3±0.1 | 0.3±0.1 | 0.2±0.1 | 0.3±0.1 | 0.3±0.1 | 0.2±0.1 | 0.3±0.1 | 0.21±0.07 | 0.24±0.11 | 0.23±0.11 |
| F | 0.3±0.1 | 0.2±0.1 | 0.2±0.1 | 0.3±0.1 | 0.2±0.1 | 0.2±0.1 | 0.3±0.1 | 0.2±0.1 | 0.2±0.1 | 0.18±0.09 | 0.17±0.09 | 0.15±0.09 | |
S-wave amplitude
In three out of four studies, it was found that the right precordial leads had predominant S waves across all age groups. In addition, these studies showed that there was a gradual decrease in amplitude magnitude when tracing from V1 on the right to lead V6.
T-wave amplitude
Based on four studies conducted, it was found that the amplitude of the T-wave on the precordial leads gradually increased with age, with the 12–15 year age group exhibiting the highest amplitude values in three out of four studies.
R/S ratio
One out of three studies reported a decreased R/S ratio in the right precordial leads, and an increased R/S ratio was observed in the left precordial leads with age [Table 6].
| Leads | Gender | Lue et al., (2018).[8] | Uygur and Aydoğdu. et al., (2019).[9] | Lue et al., (2023).[10] | ||||||
|---|---|---|---|---|---|---|---|---|---|---|
| 6–9 years | 9–13 years | 13–18 years | 5–8 years | 8–12 years | 12–16 years | 6–9 years | 9–13 years | 13–18 years | ||
| V3R | M | - | - | - | 0.88 | 0.67 | 0.54 | - | - | - |
| F | - | - | - | 0.85 | 0.60 | 0.47 | - | - | - | |
| V1 | M | 0.85±1.21 | 0.6±0.61 | 0.49±0.44 | 0.60 | 0.39 | 0.39 | 0.85 | 0.60 | 0.49 |
| F | 0.66±0.46 | 0.60±0.73 | 0.41±0.38 | 0.74 | 0.53 | 0.47 | 0.66 | 0.60 | 0.41 | |
| V2 | M | 1.23±1.04 | 1.15±1.27 | 0.88±2.28 | 0.79 | 0.65 | 0.61 | - | - | - |
| F | 1.42±1.76 | 1.09±1.71 | 0.78±1.03 | 0.68 | 0.50 | 0.52 | - | - | - | |
| V3 | M | 13.78±51.7 | 3.67±6.4 | 1.76±4.95 | - | - | - | - | - | - |
| F | 11.51±37.8 | 3.98±14.7 | 1.49±3.06 | - | - | - | - | - | - | |
| V5 | M | 9.81±13.1 | 13.70±28.8 | 13.06±31.10 | - | - | - | - | - | - |
| F | 10.19±13.2 | 11.94±28.5 | 11.36±21.76 | - | - | - | - | - | - | |
| V6 | M | 15.08±19.1 | 12.77±16.8 | 16.01±36.38 | 7.69 | 7.45 | 9.93 | 15.08 | 14.20 | 16.01 |
| F | 11.75±22.7 | 18.11±28.9 | 14.45±24.19 | 8.58 | 11.47 | 10.53 | 11.75 | 9.21 | 14.45 | |
| I | M | 5.6±10.4 | 6.6±12.9 | 6.63±13.2 | - | - | - | - | - | - |
| F | 6.4±12.1 | 4.4±6.46 | 7.36±14.8 | - | - | - | - | - | - | |
| II | M | 11.7±27.8 | 12.6±24.9 | 12.5±27.0 | - | - | - | - | - | - |
| F | 14.6±27.3 | 11.6±23.2 | 10.6±16.6 | - | - | - | - | - | - | |
| III | M | 9.4±20.5 | 7.41±15.9 | 10.1±22.7 | - | - | - | - | - | - |
| F | 12.4±25.8 | 7.96±18.9 | 10.5±20.8 | - | - | - | - | - | - | |
| aVR | M | 0.88±2.5 | 1.19±5.01 | 1.51±4.18 | - | - | - | - | - | - |
| F | 0.65±1.0 | 0.88±3.86 | 1.20±3.70 | - | - | - | - | - | - | |
| aVL | M | 2.82±8.7 | 1.09±3.07 | 1.31±4.51 | - | - | - | - | - | - |
| F | 1.07±1.6 | 0.96±2.21 | 2.09±6.78 | - | - | - | - | - | - | |
| aVF | M | 15.20±29.58 | 11.27±23.45 | 10.52±23.28 | - | - | - | - | - | - |
| F | 12.4±20.5 | 8.4±13.43 | 12.7±23.1 | - | - | - | - | - | - | |
Studies comparing lead-independent ECG indices in obese adults
The evidence from all three studies clearly shows that obese adults exhibit a significantly higher resting heart rate when compared to their normal-weight adults. In addition, two out of the three studies revealed that obese adults also have a significantly longer PR interval and QRS duration than normal-weighted adults [Table 7].
| Variables | Sun et al., (2013).[11] | Sadoh et al., (2017).[12] | Sunitha et al., (2019).[13] | |||
|---|---|---|---|---|---|---|
| Normal weight | Obese | Normal weight | Obese | Normal weight | Obese | |
| Heart rate (bpm) | 85.2±13.2 | 88.3±13 | 85±13 | 88±13 | 84.0±11.5 | 87.80±9.5 |
| PR-interval (ms/sec) | 134.5±16.3 ms | 138.7±17.5 ms | 0.150±0.02 s | 0.145±0.015 s | 0.12±0.02 s | 0.15±0.04 s |
| QRS duration (ms/sec) | 84.5±8.9 ms | 88.5±9.3 ms | 0.081±0.008 s | 0.084±0.008 s | - | - |
| QTc-interval (ms/sec) | 427.2±20.7 ms | 427.8±21.5 ms | 0.422±0.021 s | 0.425±0.021 s | 0.41±0.06 s | 0.44±0.04 s |
| P-wave axis (°) | 39.4±29.4 | 36.5±25.3 | 49.96±21.11 | 49.26±16.77 | - | - |
| QRS axis (°) | 68.3±26.8 | 58.7±23.7 | - | - | 51.4±21.8 | 54.6±25.7 |
| T-Wave axis (°) | 43.0±16.8 | 37.4±16.1 | - | - | - | - |
ms: Milliseconds
RESEARCH GAP AND RESEARCH AGENDA
The available literature and research indicate that the prediction of normal ECG standards in children and adolescents is a subject of considerable interest due to differences in ECG patterns that may exist among different populations and countries. After conducting the review study, we identified the following research gaps:
Possibility of designing age- and gender-specific reference ranges for ECG parameters among school children and adolescents in the Indian population to aid clinicians in accurate interpretation.
Exploration of automated ECG analysis for accurately identifying and interpreting ECG patterns using artificial intelligence.
Investigation of the impact of psychosocial factors, such as stress or anxiety, on ECG patterns in children and adolescents.
Explore the impact of varying levels of physical activity on the ECG patterns.
Explore the effects of diurnal variation in ECG among children.
Explore the impact of anemia on ECG patterns.
Exploration of novel technologies in ECG to ensure accurate and reliable data from the pediatric population, primarily through the utilization of Mobile ECG devices.
CONCLUSION
As a medical professional tasked with evaluating ECGs in pediatric patients, it is imperative to take into consideration various individual factors such as age, gender, and BMI. These factors can significantly impact the interpretation of ECG results and ultimately affect the accuracy of diagnoses. In addition, specific ECG patterns may require closer scrutiny and necessitate a more comprehensive assessment to ensure that all potential issues are identified and addressed promptly. Therefore, it is essential to approach each ECG evaluation with a thorough and meticulous approach to provide the best possible care for pediatric patients.
Ethical approval
The Institutional Review Board approval is not required.
Declaration of patient consent
Patient consent is not required as there are no patients in this study.
Conflicts of interest
There are no conflicts of interest.
Use of artificial intelligence (AI)-assisted technology for manuscript preparation
The authors confirm that there was no use of artificial intelligence (AI)-assisted technology for assisting in the writing or editing of the manuscript, and no images were manipulated using AI.
Financial support and sponsorship
Nil.
References
- Electrocardiogram In: StatPearls. Treasure Island, FL: StatPearls Publishing; 2024. Available from: https://www.ncbi.nlm.nih.gov/books/NBK549803 [Last accessed on 2023 Jun 05]
- [Google Scholar]
- Electrocardiographic Manifestations: Pediatric ECG. J Emerg Med. 2008;35:421-30.
- [CrossRef] [PubMed] [Google Scholar]
- The Pediatric ECG. Emerg Med Clin North Am. 2006;24:195-208, vii-viii
- [CrossRef] [PubMed] [Google Scholar]
- The Pediatric Electrocardiogram Part II: Dysrhythmias. Am J Emerg Med. 2008;26:348.
- [CrossRef] [Google Scholar]
- Electrocardiographic Pattern of Apparently Healthy Primary School Children Aged 5-15 Years, in Kano. Heart India. 2015;3:12-7.
- [CrossRef] [Google Scholar]
- A Study of Electrocardiographic Pattern of Normal School Children Aged between 5-15 Years in Nandyal, Andhra Pradesh. Int J Contemp Med Res. 2015;2:1322-6.
- [Google Scholar]
- A Study of Electrocardiographic Pattern of Normal School Children in Palakkad District of Kerala. Int J Pediatr Res. 2016;3:849-55.
- [CrossRef] [Google Scholar]
- Study on ECG in the Adolescent. Pediatr Cardiol. 2018;39:911-23.
- [CrossRef] [PubMed] [Google Scholar]
- Normal Electrocardiogram Values of Healthy Children. Turk Pediatri Ars. 2019;54:93-104.
- [CrossRef] [PubMed] [Google Scholar]
- Normal ECG Standards and Percentile Charts for Infants, Children and Adolescents. Pediatr Neonatol. 2023;64:256-73.
- [CrossRef] [PubMed] [Google Scholar]
- Association between Obesity and ECG Variables in Children and Adolescents: A Cross-sectional Study. Exp Ther Med. 2013;6:1455-62.
- [CrossRef] [PubMed] [Google Scholar]
- Electrocardiographic and Echocardiographic Findings in Adolescent Overweight and Obese Secondary School Children in Benin City, Nigeria. J Adv Med Med Res. 2017;23:1-8.
- [CrossRef] [Google Scholar]
- Effect of Obesity on Electrocardiographic Parameters in Children: A Comparative Study. Int J Physiol. 2019;7:146-51.
- [CrossRef] [Google Scholar]